
Device Yield Analysis
Overview
Device Yield analysis allows users to quickly calculate the device yield for a given sample. Then, given the device yield, the analysis assigns the sample a pass or fail status.
Each device on the sample is sorted into a user-defined bin. Each bin has a set of user-defined passing criteria. In order for an entire sample to pass, the percentage of devices that pass must exceed the user-set threshold.
Most Device Yield parameters are written with SQL queries, so knowledge of SQL is required to write the nJson setting file. For assistance with setup, contact support@nanotronics.ai.
This analysis is typically set up as a group analysis in a production environment, in which the Device Yield analysis runs after a Device Inspection analysis that detects sample defects.
Analysis Parameters
Device Yield analysis contains four parameters: Base Analysis ID Mode, Base Analysis ID, Device Yield Threshold, and Device Yield Setting.
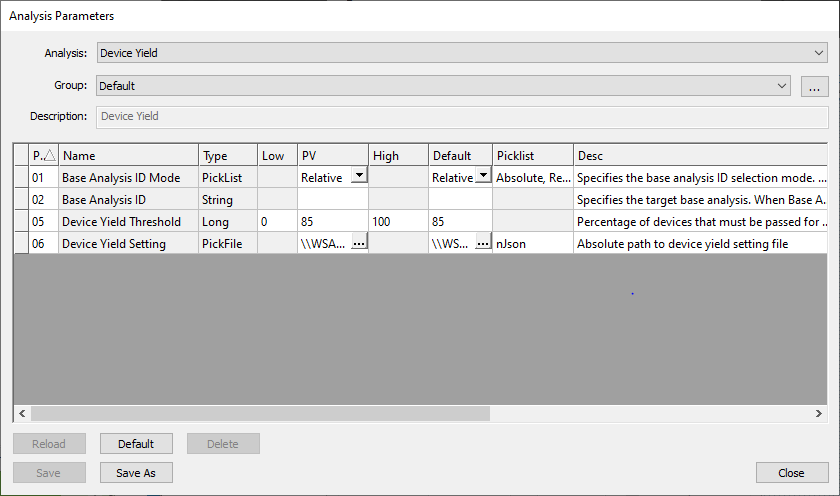
Device Yield Analysis Parameter dialog
Parameter Description
Parameter Name | Type | Range | Description |
|---|---|---|---|
Base Analysis ID Mode | Picklist | Absolute, Relative | See Post-Analysis Referencing for usage instructions. |
Base Analysis ID | String | Comma separated list of IDs or analysis names. | See Post-Analysis Referencing for usage instructions. Must point to a previous analysis that outputs devices, like Device Inspection. |
Device Yield Threshold | Long | 0 to 100. | Represents the percentage of devices on a sample that must meet passing criteria in order for the entire sample to pass. |
Device Yield Setting | nJson File | Setting file defines bins and bin-specific passing criteria for a given sample. |
Device Yield Setting Parameter
The Device Yield Setting nJson file contains analysis configuration details, including bin definitions and nView report settings, .
Example nJson File
Below is an example Device Yield Setting nJson file.
{
  "Device Report": {
    "inputTablesNames": "src",
    "BinFallThrough": 1,
    "PassColor": "64FF64",
    "FailColor": "FF6464",
    "Filtering"	  :
	{
		"Inclusive" : true,
		"query"     : "SELECT DeviceID FROM vwDevice"
	},
    "Bins": [
      {
        "description": "Perfect",
        "value": 1,
        "pass": true,
        "color": "ADD8E6"
      },
      {
        "description": "Very Good",
        "value": 2,
        "pass": true,
        "color": "E0FFFF"
      },
      {
        "description": "Good",
        "value": 3,
        "pass": true,
        "color": "FFB6C1"
      },
      {
        "description": "Almost Good",
        "value": 4,
        "pass": false,
        "color": "FFA07A"
      },
      {
        "description": "Not Good",
        "value": 5,
        "pass": false,
        "color": "20B2AA"
      }
    ],
    "BinsQueries": [
      {
        "bin": 1,
        "priority": 5,
        "query": "SELECT DeviceID, Count(*) AS AddDesc FROM src GROUP BY DeviceID HAVING Count(*) < 300"
      },
      {
        "bin": 2,
        "priority": 4,
        "query": "SELECT DeviceID, Count(*) AS AddDesc FROM src GROUP BY DeviceID HAVING Count(*) >= 300 AND Count(*) < 400"
      },
      {
        "bin": 3,
        "priority": 3,
        "query": "SELECT DeviceID, Count(*) AS AddDesc FROM src GROUP BY DeviceID HAVING Count(*) >= 400 AND Count(*) < 500"
      },
      {
        "bin": 4,
        "priority": 2,
        "query": "SELECT DeviceID, Count(*) AS AddDesc FROM src GROUP BY DeviceID HAVING Count(*) >= 500 AND Count(*) < 1000"
      },
      {
        "bin": 5,
        "priority": 1,
        "query": "SELECT DeviceID, Count(*) AS AddDesc FROM src GROUP BY DeviceID HAVING Count(*) >= 1000"
      }
    ]
  }
}
nJson File Properties
Bins
The Bins property includes the following nested properties:
descriptiona string to name the given bin.valuean integer used to identify and reference the bin.passa boolean representing if devices sorted into the given bin pass or fail.colora string representing a color in hex code, which is used to label devices of the given bin in Device Yield nView reports.
In the example nJson file, the user defines five bins. Devices sorted into "Perfect", "Very Good", and "Good" bins as are assigned a passing value, and devices sorted into "Almost Good" and "Not Good" bins are assigned a failing value.
BinsQueries
The BinsQueries property includes the following nested properties:
binan integer referencing aBinproperty’svalueproperty.priorityan integer representing the order in which theBinsQueriesshould evaluate a device.querya SQL query that defines which devices are assigned to the given bin.
In the example nJson file, the devices are sorted into bins based on the device’s defect count. The "Not Good" bin contains devices with more than 1000 defects, and "Perfect" contains devices with less than 300 defects.
BinQueries are also given priorities. If a device can be sorted into more than one bin, it will be assigned to a bin via the order defined by the priority.
Here, the condition for bin 5 or "Not Good" is checked first because it has a priority of 1. We recommend checking the most critical defect conditions first.
BinFallThrough
If every bin is checked and the given wafer does not meet the criteria for any of the bins, the device is sorted into the bin defined via the BinFallThrough.
In this example, the fall through bin is 1, or "Perfect".
inputTablesNames
This property defines a name for the input SQL table, which includes all of the relevant scan data for a given sample.
In this example, the input table is named src, and is referenced in the BinsQueries' nested property SQL query.
Filtering
Filtering is an optional property which creates a temporary filtered view of the scan database for BinQueries to parse.
The query nested property is the SQL query used to filter the database. The Inclusive nested property is a boolean that determines if the database entries that meet the filter query condition are included or excluded from the output.
PassColor / FailColor
PassColor and FailColor determine the colors that the sample’s passing and failing devices are labeled with in the nView Device Yield Report.
Writing SQL Queries
SQL queries should query the scan database’s vwDevices table, which contains defect details.
For example, defects can be sorted into bins by the type of defects found and/or the size of those defects. See below for all column names in the vwDevices table.
Here is an example of a query filters the input table for defects with defect type “EXTREMELY_BAD_DEFECT_TYPE” that are larger than 15 µm2.
"SELECT DeviceID, Area, ClassName FROM src WHERE Area >= 15 AND ClassName = \"EXTREMELY_BAD_DEFECT_TYPE\" GROUP BY DeviceID"vwDevices Column Names
Column Name | Data Type |
|---|---|
DefectID | INTEGER |
ImageID | INTEGER |
AnalysisID | INTEGER |
DeviceID | INTEGER |
X | REAL |
Y | REAL |
W | REAL |
H | REAL |
Area | REAL |
Eccentricity | REAL |
Orientation | REAL |
XinDevice | REAL |
YinDevice | REAL |
ClassID | INTEGER |
Score | REAL |
Contour | TEXT |
ClassName | VARCHAR |
Device Yield Report
Overview
After successfully running Device Yield analysis on a defect-type scan, the analysis results can be viewed in nView. The Device Yield report can be viewed by accessing nView > View > Device Yield Report or Ctrl+ 7.
Device Yield Report Views
The Device Yield report has multiple different views that can be seen by toggling Pass/Fail and Bins, in addition to hovering over individual pass/fail or bin table rows.
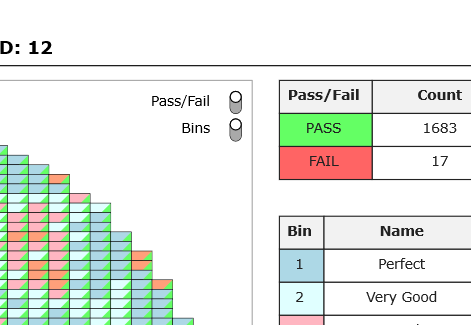
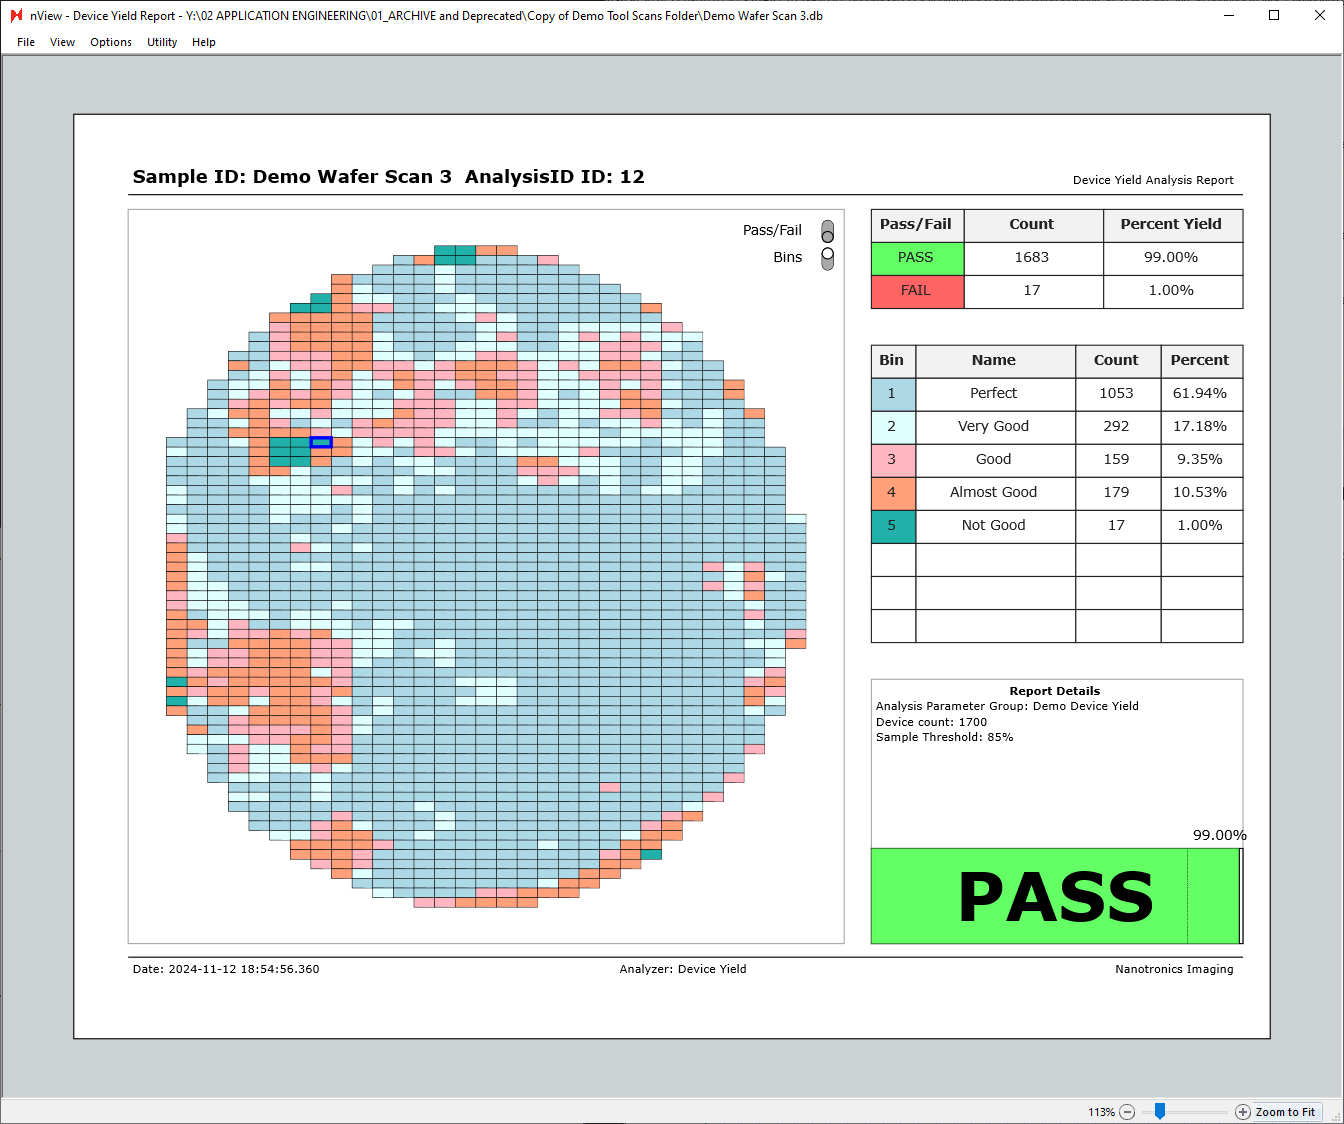
In the next image, both the Pass/Fail and Bins views are turned on.
Each square represents a device, with the color in the top left corner of each device representing the bin associated with the device, and the color in the bottom right corner representing the pass/fail status of the device.

Bins can be toggled off to only show the pass/fail status of each device.

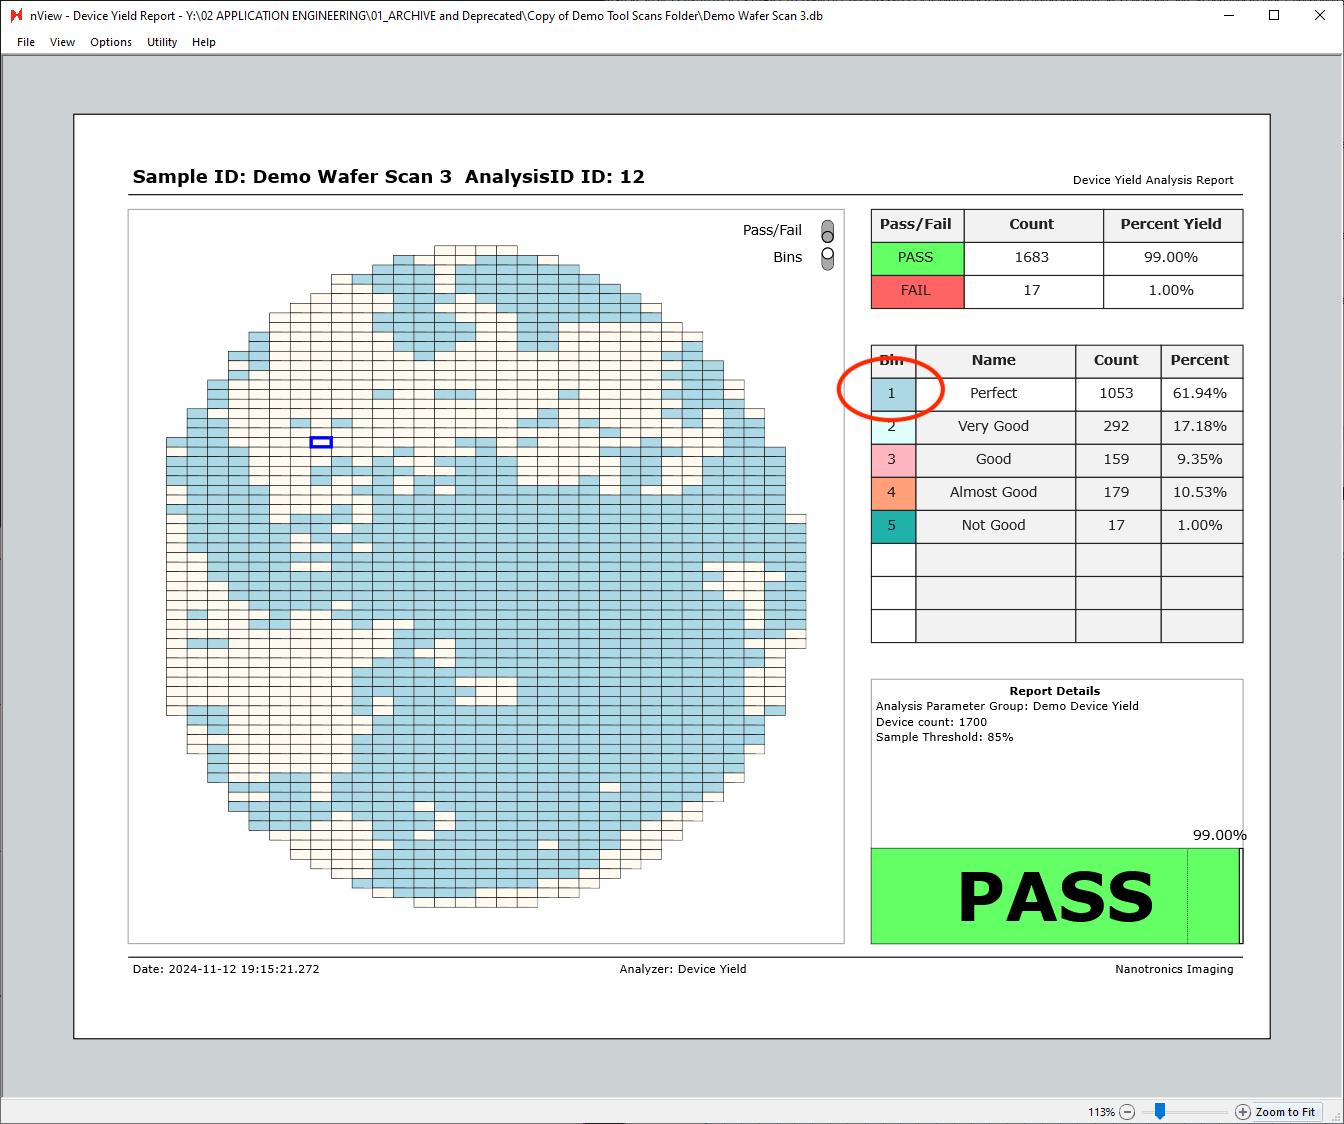
Similarly, Pass/Fail can be toggled off to show the device bins only.
Additionally, hovering over any of the table rows on the right side of the report will highlight the given row’s bin. The view below is with the bins view only enabled, with cursor hovered over the “Bin 1 - Perfect” row.
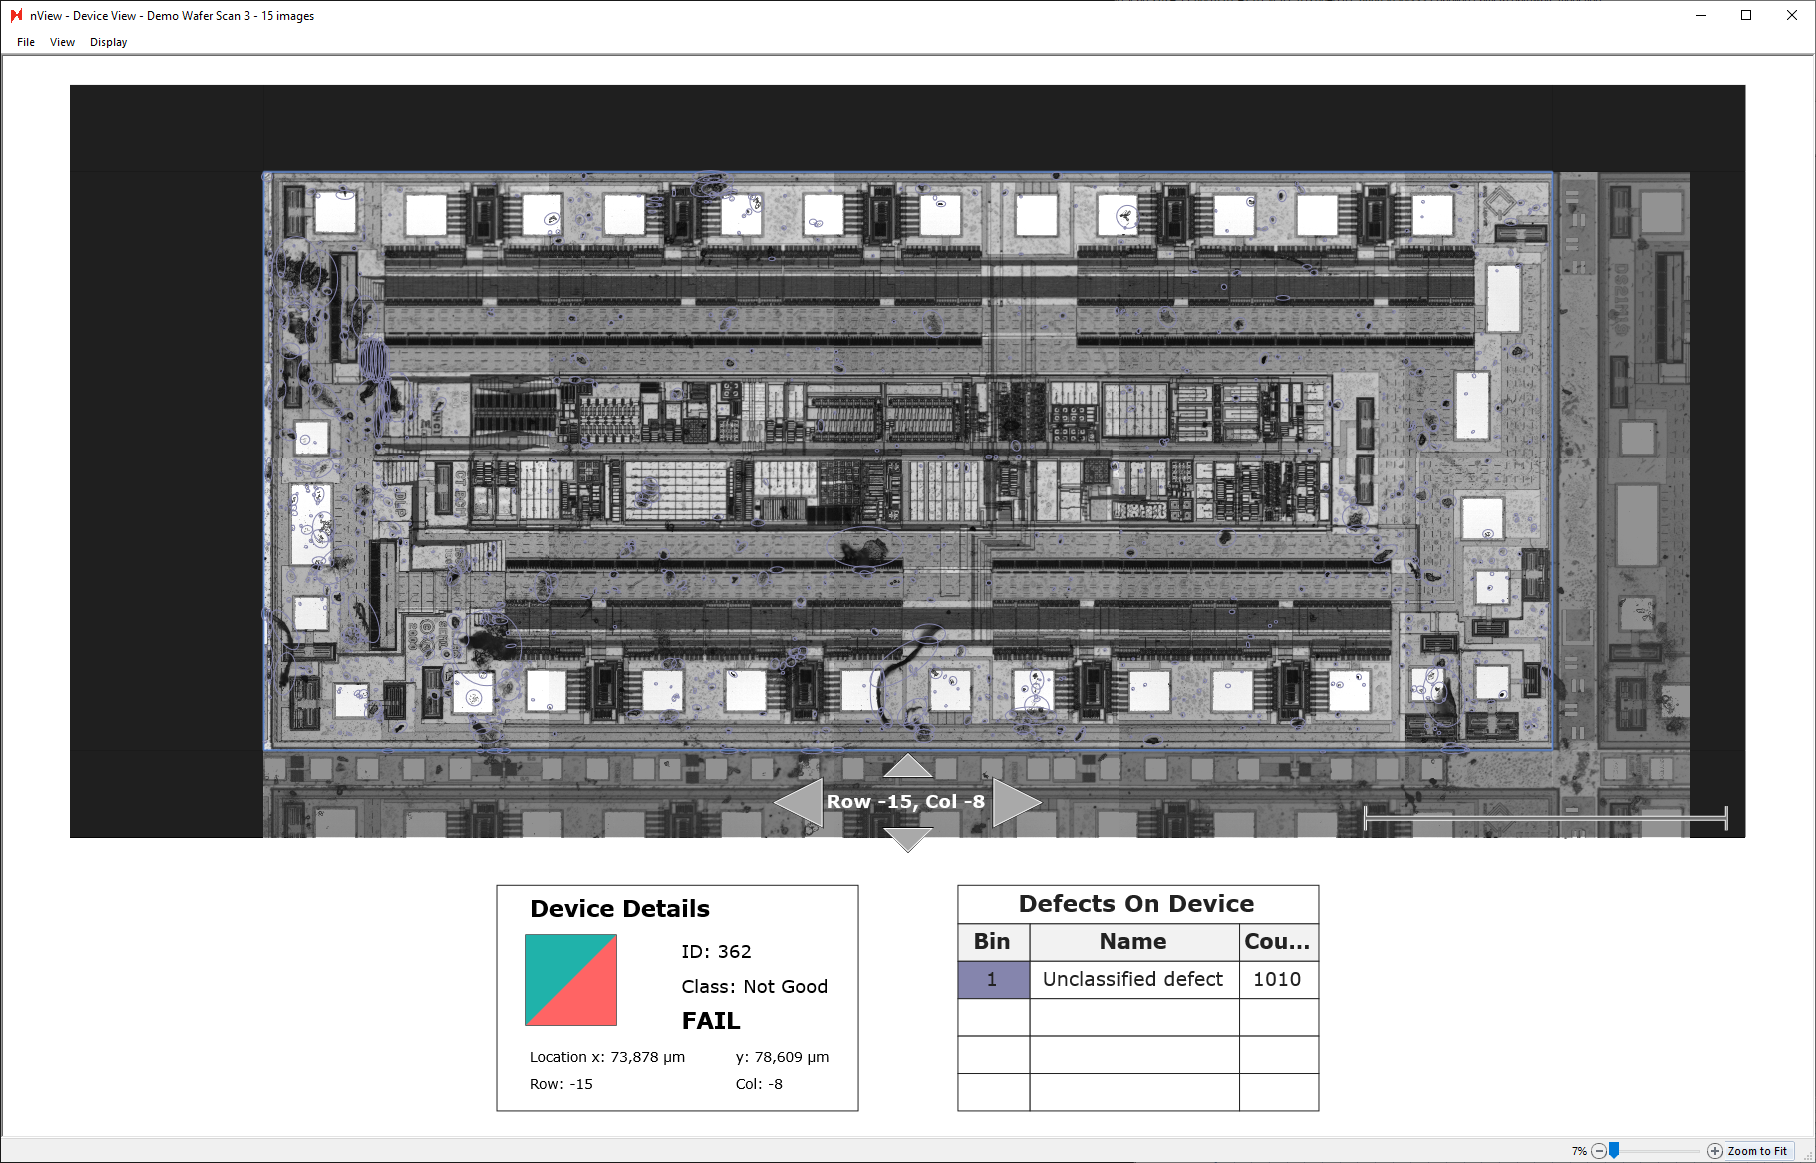
Individual Device View
Individual devices can also be inspected more closely by double-clicking any of the device tiles in the device yield report. Double-clicking a device tile will open a new window of the device view.
Using the up, left, down, right arrows allows you to navigate to view neighboring devices.
Exporting Device Yield Report
Device yield reports can be manually saved and exported directly at nView > File > Save As…
Additionally, they can be exported automatically by placing a Report Summary Image Export after a device yield analysis in an analysis group.