
Surface Scattering Analysis
Overview
A common request from customers is to be able to measure the surface roughness of a sample. Surface roughness is closely related to haze, which is the optical phenomenon resulting from surface roughness. This analysis is also commonly referred to as “haze analysis”.
nSpec’s Surface Scattering Analysis works by measuring the intensity of scattered light when scanning a sample in Darkfield Illumination mode. This analyzer has two reporting options:
An interactive Surface Scattering report within nView.
A PNG summary export and CSV data file.
Input Scan Requirements
Darkfield Illumination
This analyzer requires the target scan to have been captured in Darkfield Illumination mode. Darkfield Illumination captures more meaningful topographical data because of the oblique angle of incidence utilized in darkfield imaging.
Bare Wafer Samples
Surface Scattering Analysis can theoretically be performed with both bare and patterned wafers, however, performing the analysis on a patterned wafer may not generate meaningful results or useful data, so it is highly recommended for use to analyze bare wafers only.
Analysis Parameters
There are only two analysis parameters for Surface Scattering Analysis. For the most part, the two parameters don’t need to be touched.
Export Map Bins determines the number of bins used to display haze data in nView.
Export JSON is used to export analysis results to a JSON file.
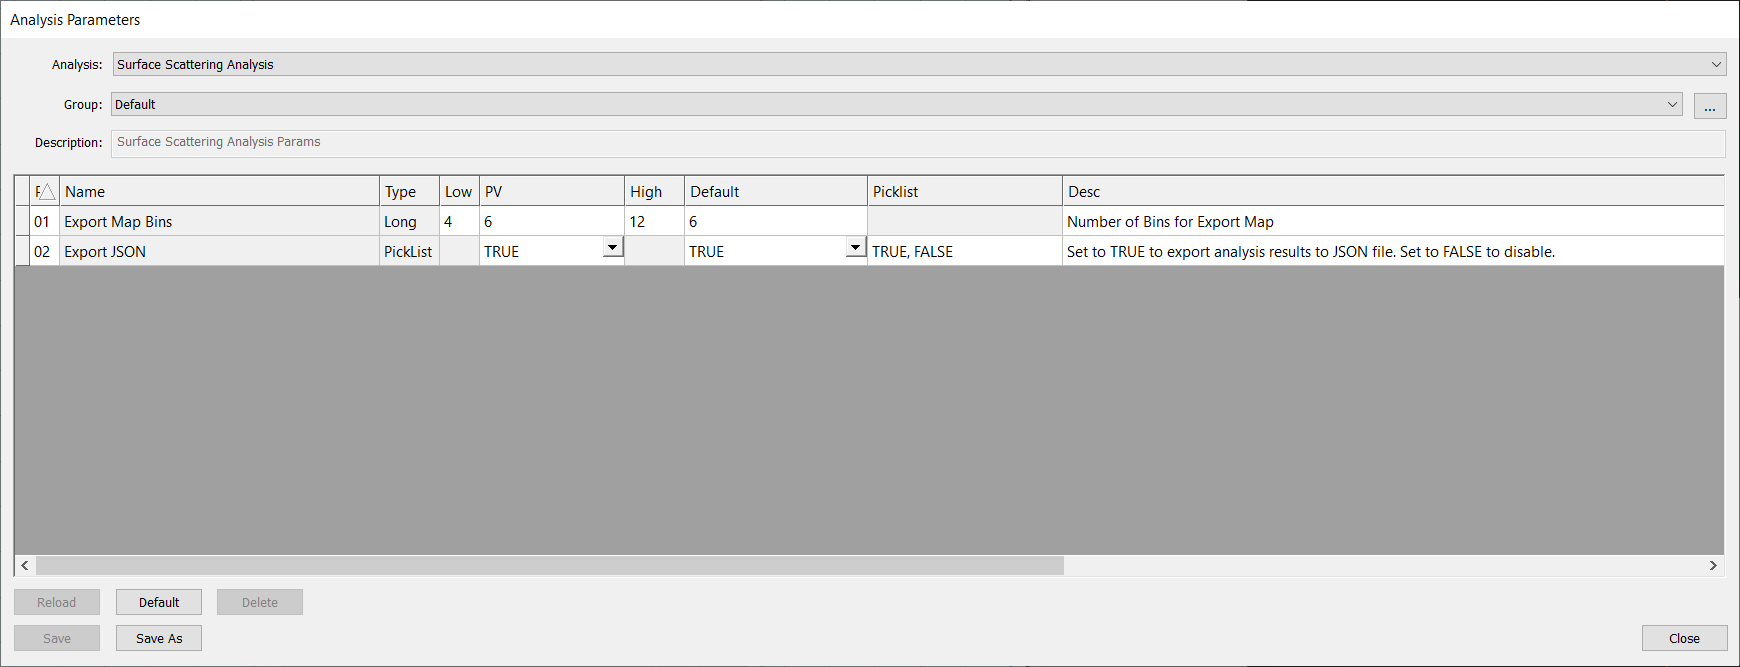
Analysis Parameters Dialog
Reporting
Interactive nView Report
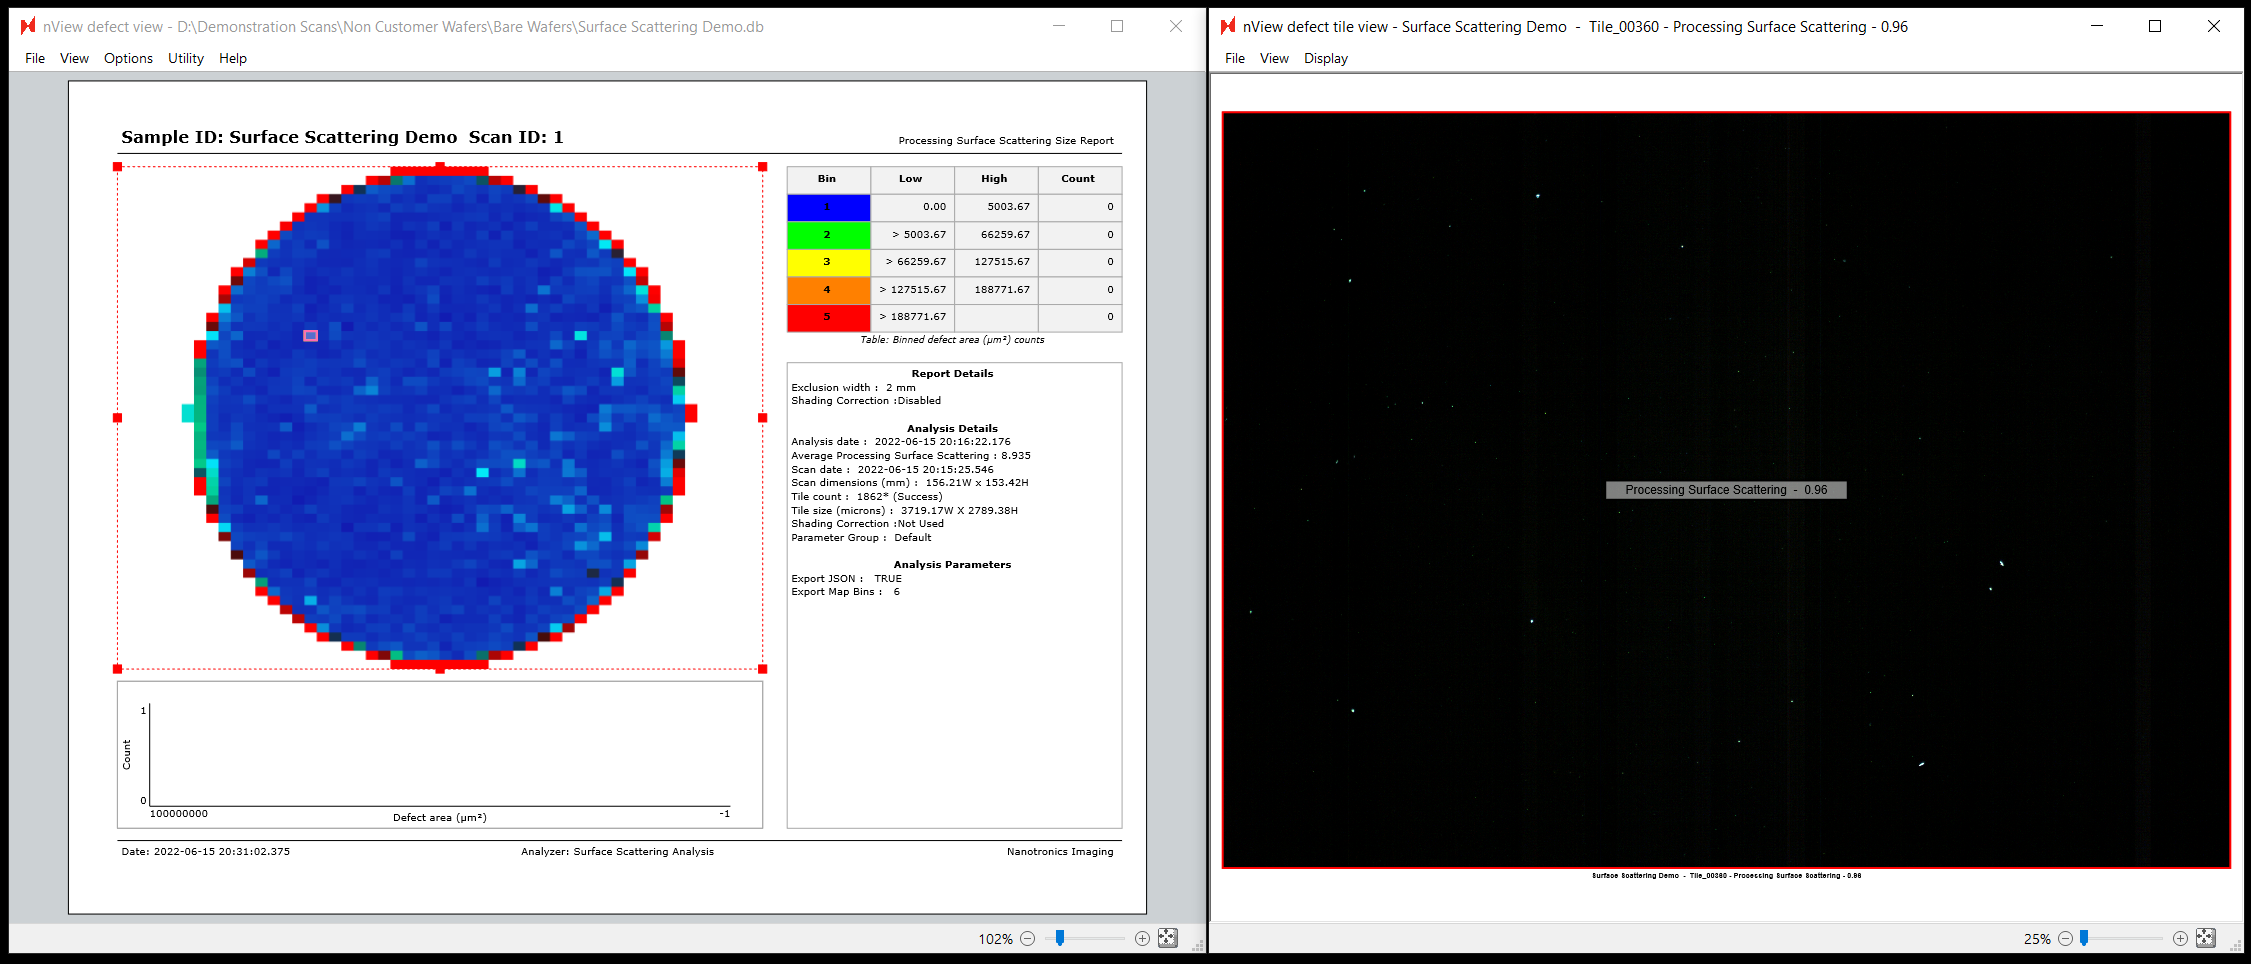
To view the surface scattering report within nSpec, you will need to open the Image Property Report. This should open by default when viewing results for the Surface Scattering Analysis, however you may then need to select either Map or Merged mode to see the results on the sample map, if that mode is not set as your reporting default.

To view the value for a specific image tile, simply click on the target image and view the value printing in the middle of the tile to the right.
The surface scattering value is a unitless measurement, and correlates with how much pixel-scale scattering there is. It is roughly equivalent to an average brightness of background pixels in a darkfield scan. The higher the number, the more haze is present.
Exports
A number of exports will also be generated by default for this analysis and saved to the scan analysis folder.
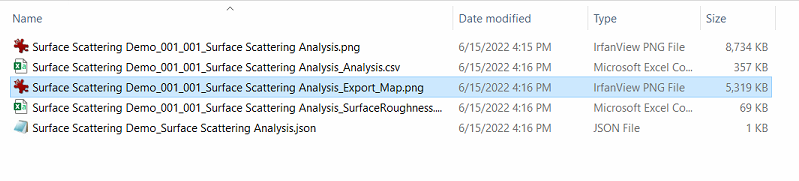
This includes a PNG report visualizing the surface scattering values across the sample:

As well as a CSV report with the same information in the following columnar form:
Row | Column | X (Microns) | Y (Microns) | Surface Scattering Value |
26 | 0 | 22122.7 | 100859 | 6.294322491 |
27 | 0 | 22122.7 | 103649 | 6.334250689 |
31 | 1 | 25841.9 | 114806 | 9.976365487 |
The analysis parameters also provide an option to export the standard JSON file that all nSpec analyzers generate, however since this analysis does not produce defect-type results this JSON file will be mostly empty and not interesting to consume externally. We recommend instead focusing on the surface scattering PNG and CSV exports, or using the interactive report within nView.