
Device Yield Report
Overview
After successfully running Device Yield analysis on a defect-type scan, the analysis results can be viewed in nView. The Device Yield report can be viewed by accessing nView > View > Device Yield Report or Ctrl+ 7.
Device Yield Report Views
The Device Yield report has multiple different views that can be seen by toggling Pass/Fail and Bins, in addition to hovering over individual pass/fail or bin table rows.
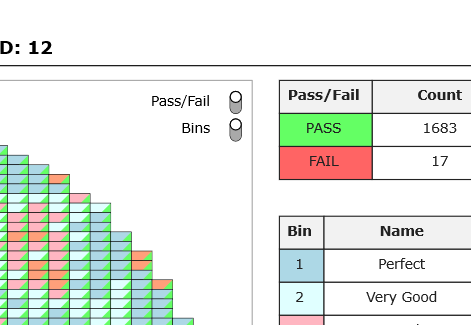
In the next image, both the Pass/Fail and Bins views are turned on.
Each square represents a device, with the color in the top left corner of each device representing the bin associated with the device, and the color in the bottom right corner representing the pass/fail status of the device.

Bins can be toggled off to only show the pass/fail status of each device.

Similarly, Pass/Fail can be toggled off to show the device bins only.
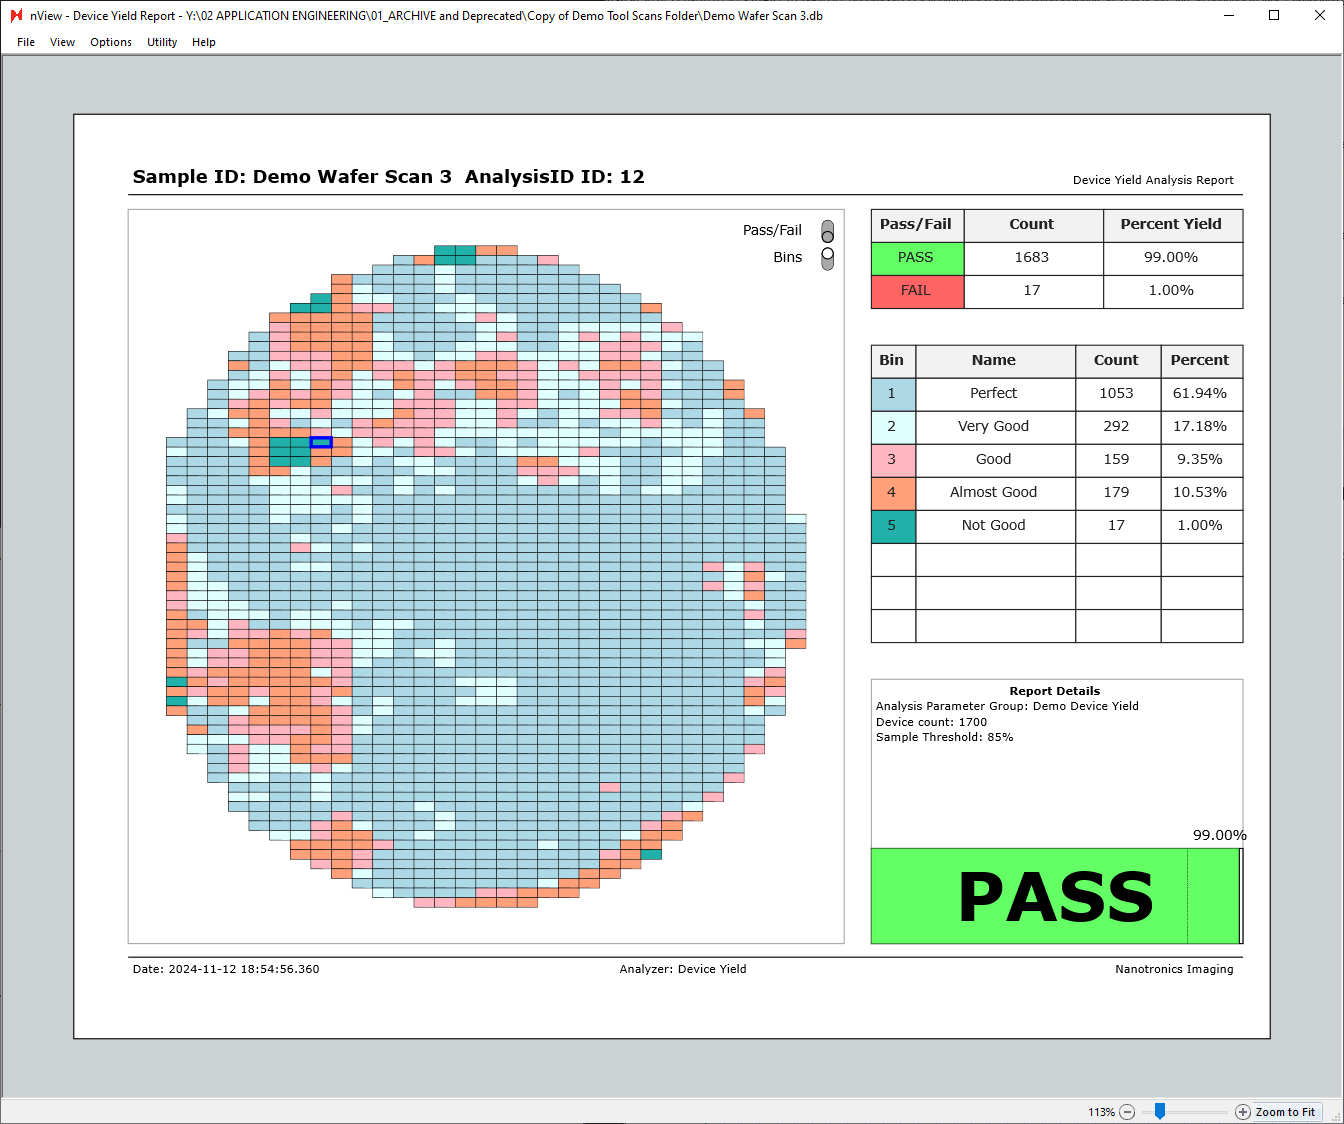
Additionally, hovering over any of the table rows on the right side of the report will highlight the given row’s bin. The view below is with the bins view only enabled, with cursor hovered over the “Bin 1 - Perfect” row.
Individual Device View
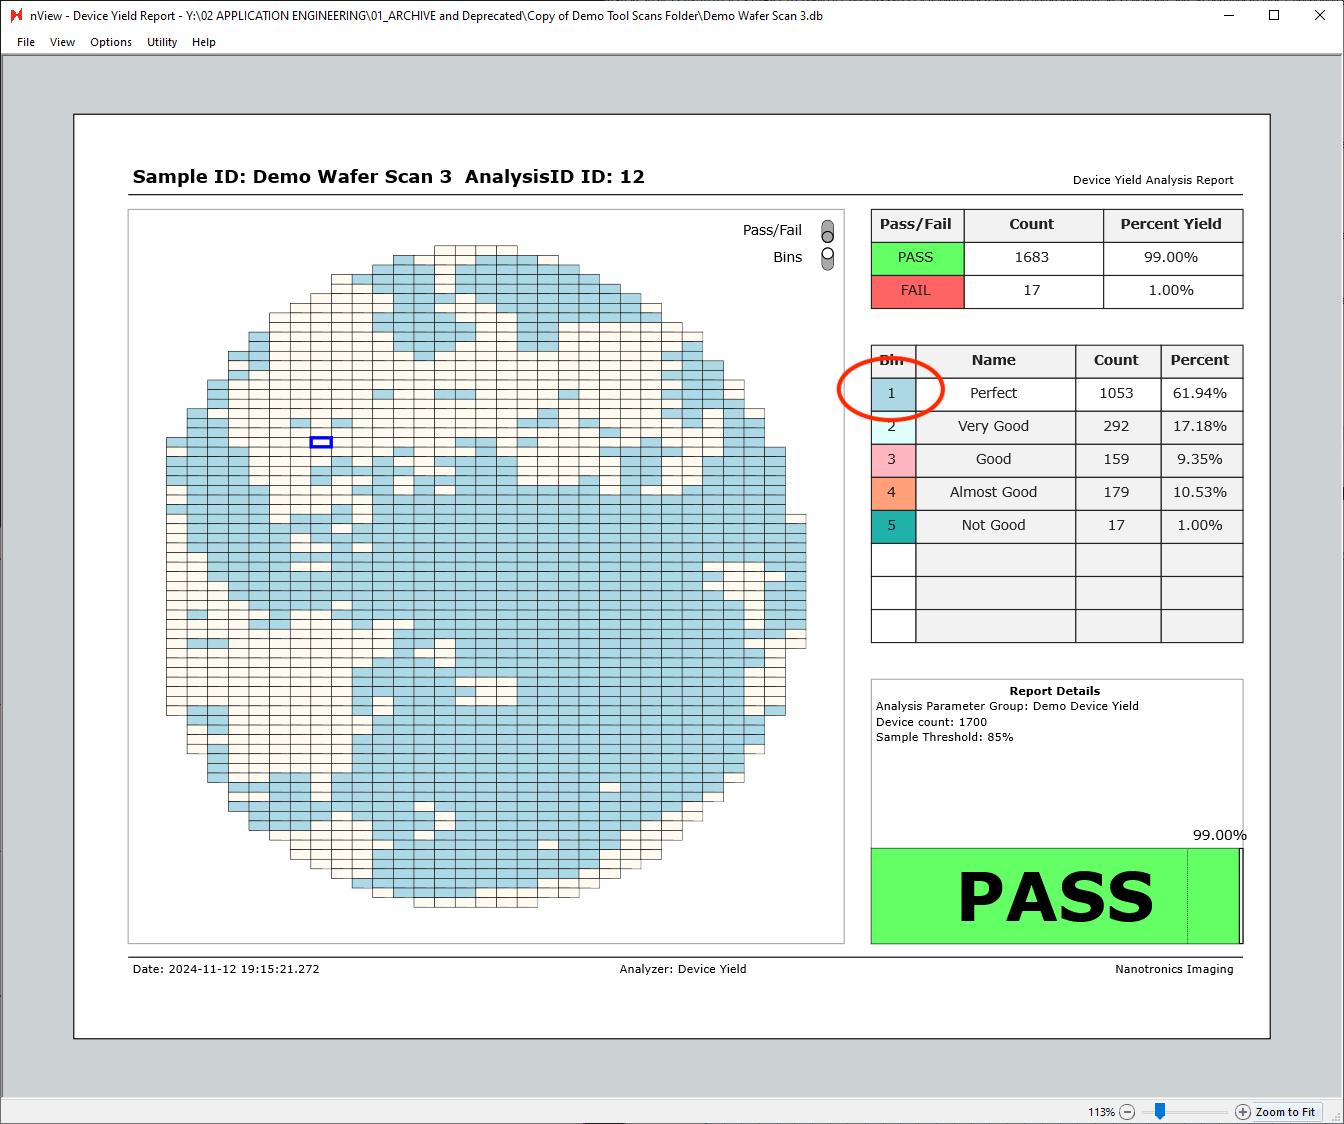
Individual devices can also be inspected more closely by double-clicking any of the device tiles in the device yield report. Double-clicking a device tile will open a new window of the device view.
Using the up, left, down, right arrows allows you to navigate to view neighboring devices.
Exporting Device Yield Report
Device yield reports can be manually saved and exported directly at nView > File > Save As…
Additionally, they can be exported automatically by placing a Report Summary Image Export after a device yield analysis in an analysis group.