
Bare Wafer Workflow
Overview
In this guide, we will demonstrate how to scan a bare wafer and analyze it using a basic selection analyzer. We will be using a 150 mm blank silicon wafer for this demo, with the flat oriented towards south.
Creating an Image Setting Group
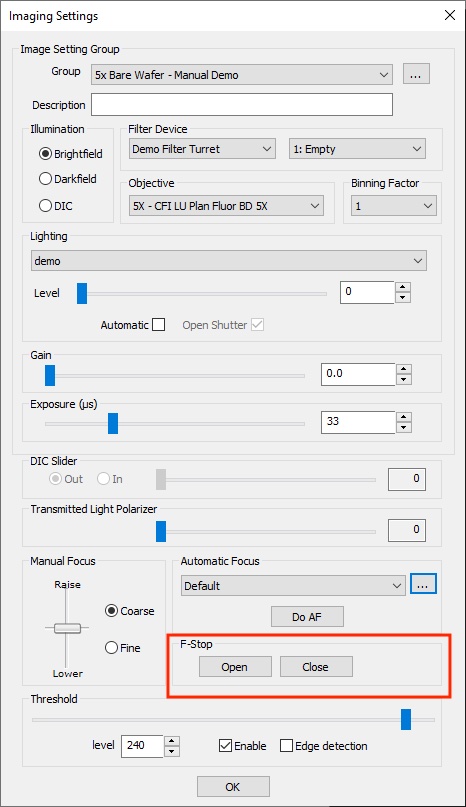
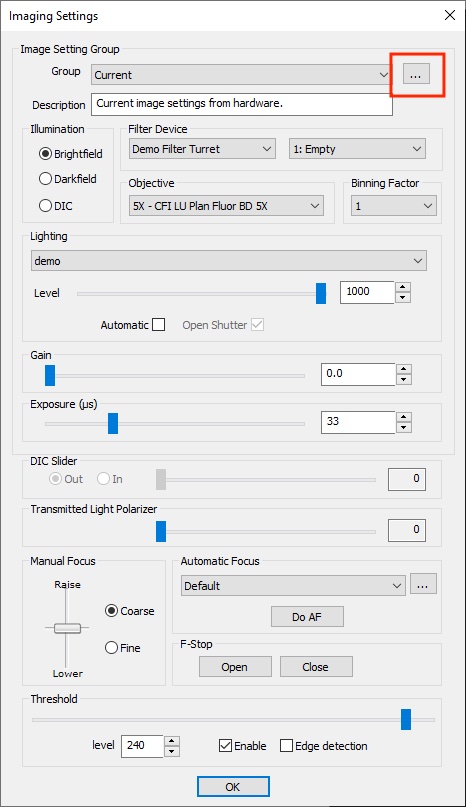
After loading the sample onto the stage, open up the Imaging Settings dialog at nScan - Camera View > Camera > Imaging Settings...
First, use Manual Focus to get the sample in focus. You should also enable the F-Stop with Close, which will help the system focus on a bare sample.
You may also need to adjust the lighting conditions to see the sample. We recommend first increasing the brightness to the maximum, and then increasing the exposure as necessary. We will refine lighting conditions in the following step.
Adjusting Lighting Conditions
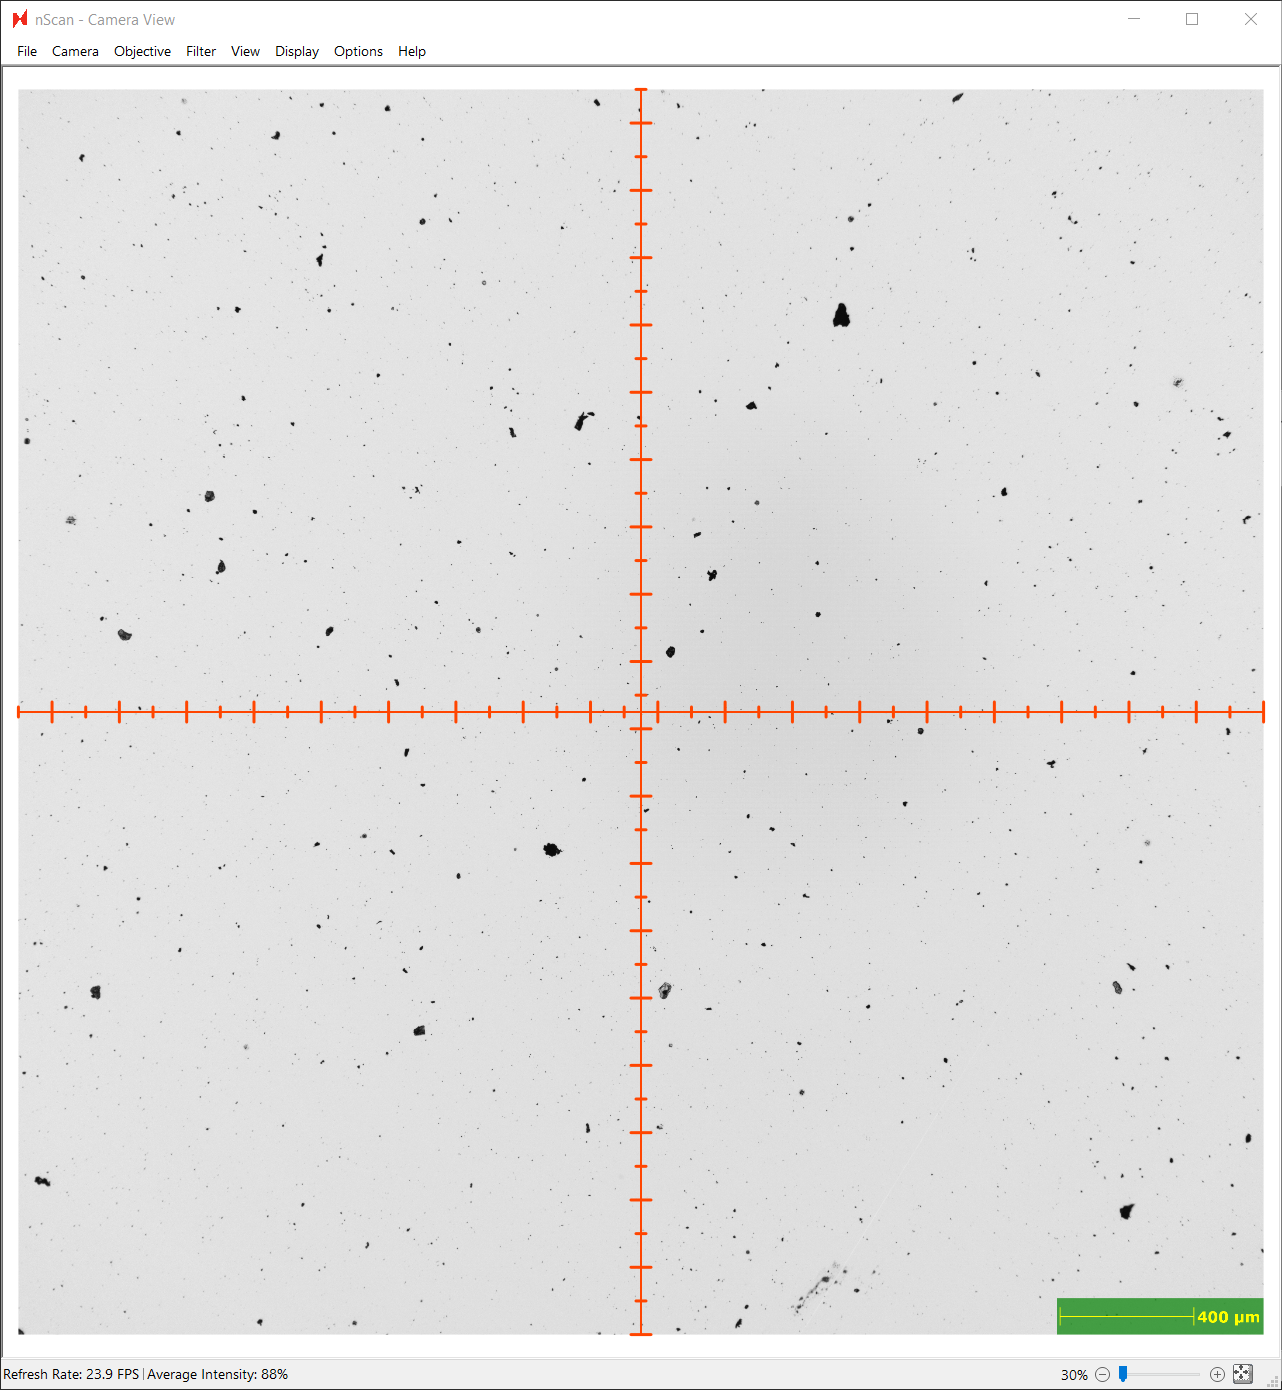
For this bare silicon wafer, we will select Brightfield illumination mode and use a 5x objective, which allows us to clearly see the defects of interest on this wafer.
We will enable the Threshold tool at Level 240, located at the bottom of the Image Settings dialog, to assist in finding the optimal lighting conditions. We recommend ensuring that the field of view contains some defects or scratches during this step, if possible.
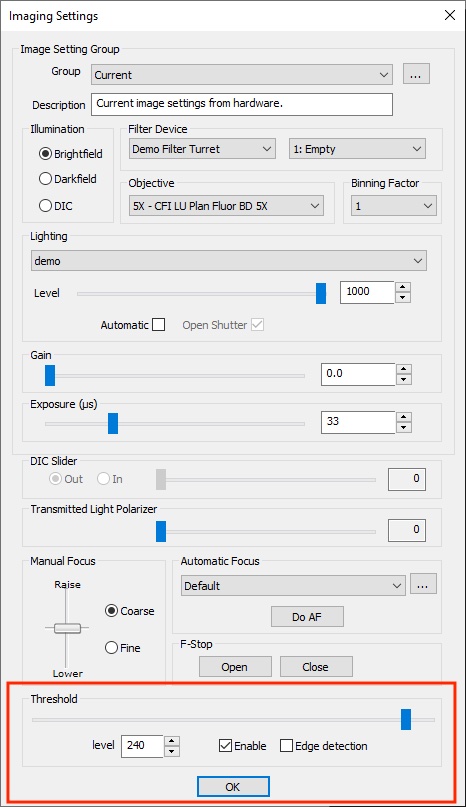
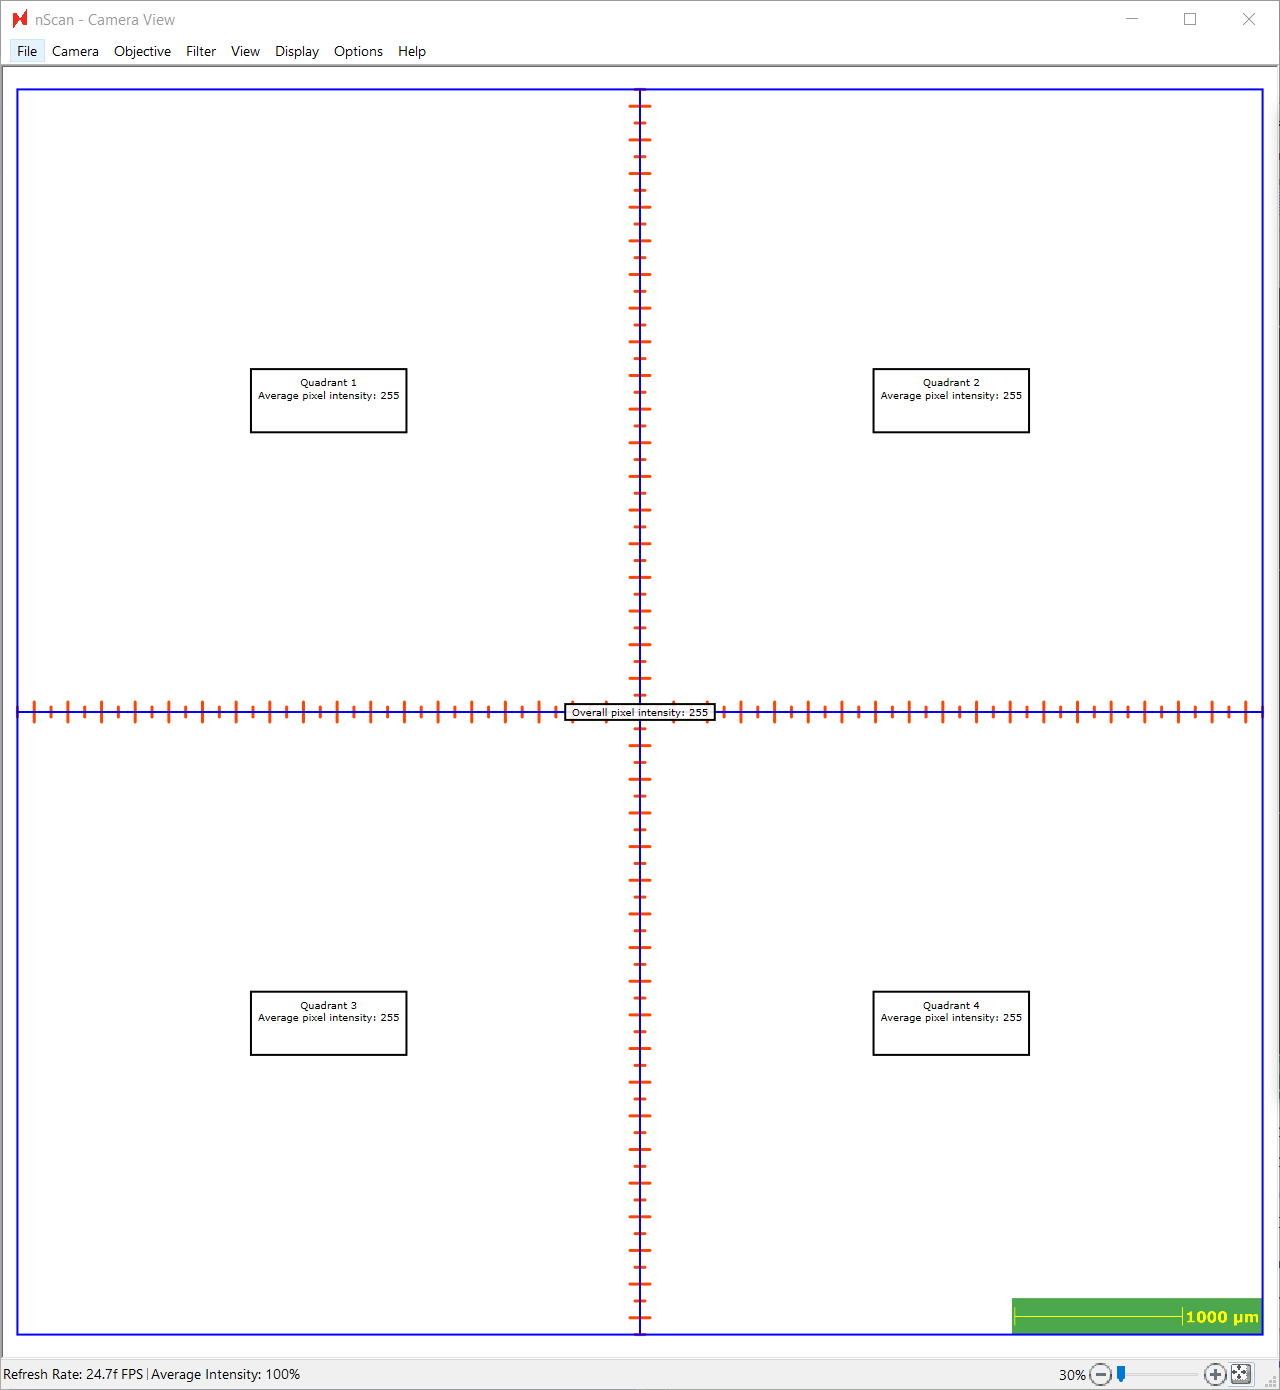
At a threshold level of 240, the entire camera view should be white. If any defects or scratches are visible, continue to increase the Exposure until they are not visible. This step aids the post-scan computer vision analysis in distinguishing defects.
Click the … button to save the imaging settings. We will save our settings as “5x Bare Wafer - Manual Demo”.
Configuring Autofocus
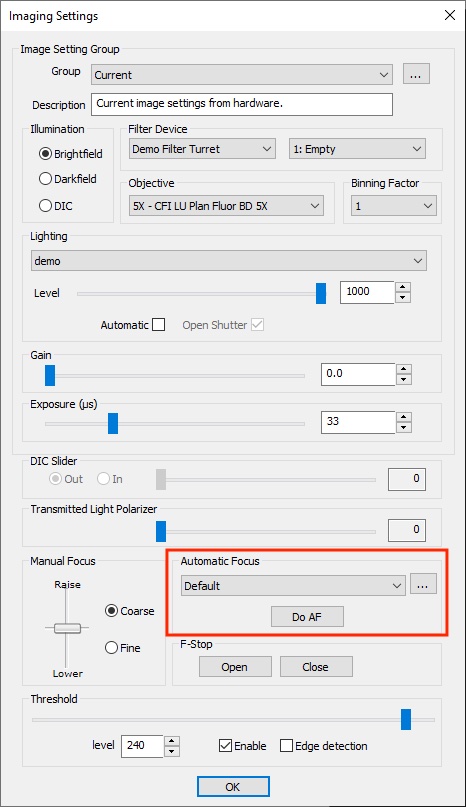
Next, we will configure the autofocus settings, which can be edited from the … button in the Automatic Focus section of Imaging Settings.
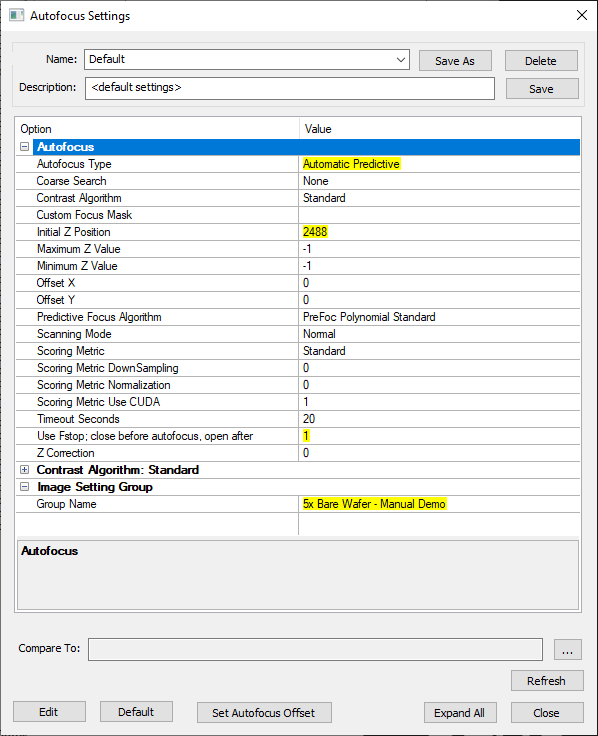
After opening the Autofocus Settings:
Click Set Autofocus Offset at the bottom of the dialog to update the Initial Z Position to be the current stage position.
Change the Autofocus Type to Automatic Predictive.
Set Use Fstop to 1. This is imperative for bare wafers because the F-stop helps provide necessary contrast in order to focus on the imaging plane.
Set the Imaging Setting Group - Group Name to the image setting group you just created.
Make sure to save a new Autofocus Setting group with Save As. We will save our group as “5x Bare Wafer - Manual Demo AF”.
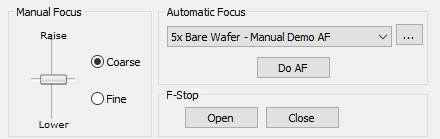
Be sure to point to this Autofocus Setting in the Automatic Focus section of the Image Settings dialog. Don’t forget to save the Image Settings Group again.
Perform Bare Wafer Alignment
We highly recommend performing and saving a Bare Wafer Alignment using the Bare Wafer Alignment Wizard. This alignment file will help orient the camera to the center of the sample. Alignment requires both Autofocus and Image Settings to be setup.
Navigate to the wizard at nScan - Stage View > Scan > Bare Wafer Alignment > Start Wizard….
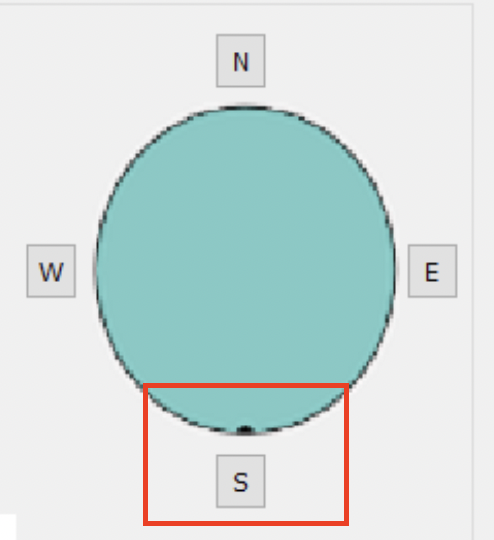
We have placed this sample on the stage with the single flat facing south. Thus, we will setup the wizard with the following settings:
Select the Wafer Fiducial to be Single Flat.
Set the Autofocus settings to our previously created autofocus setting.
Set the Image Settings to our previously created image setting group.
Under Wafer Trace Settings, select the S point, which indicates that the fiducial is oriented to the south on the stage.
Once all settings are set, click Run Test Alignment, which will perform alignment.
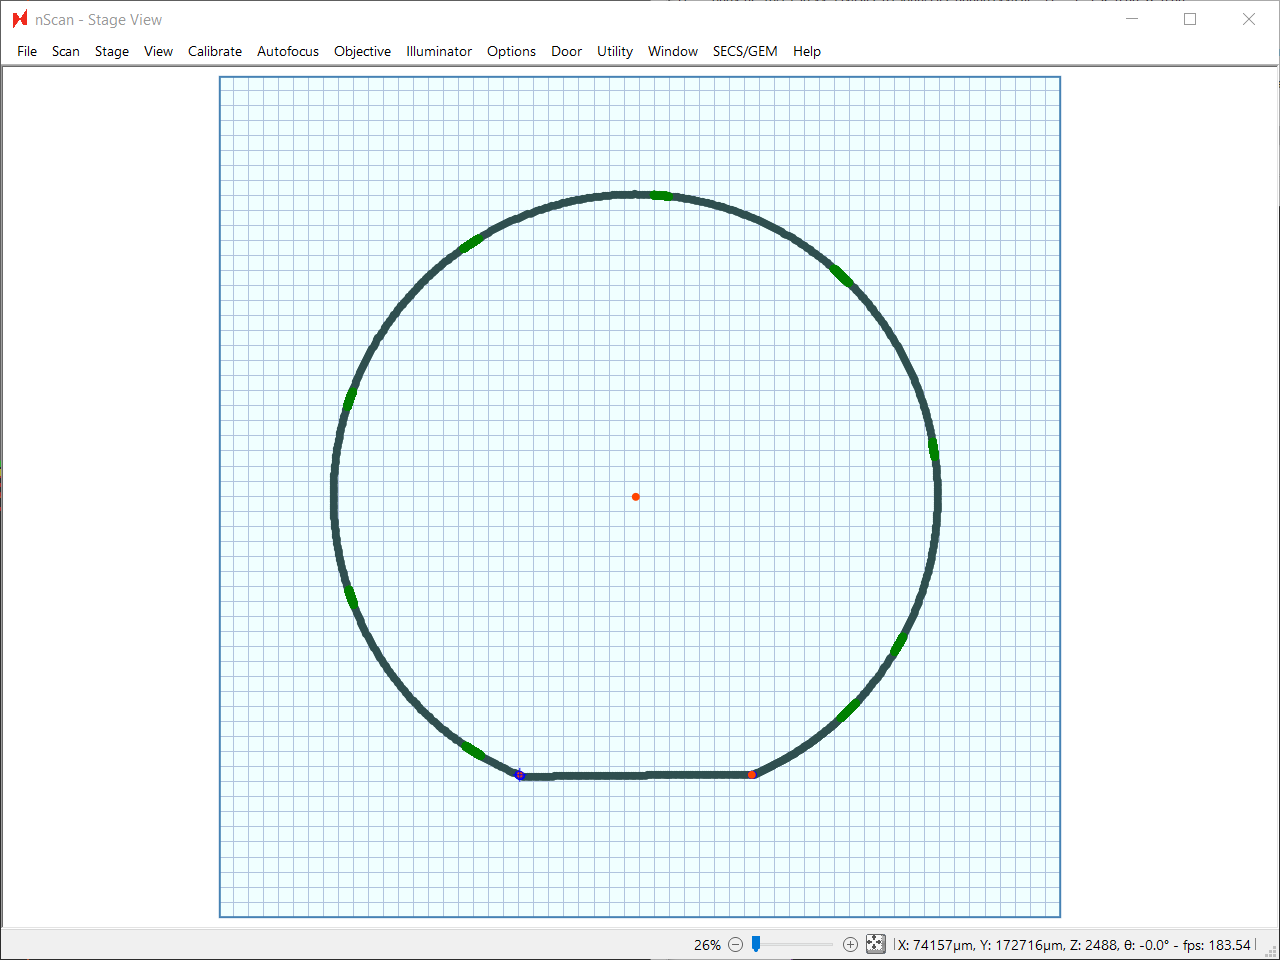
Once alignment is finished, the nScan - Stage View will populate with all of the points found, including the detected center point of the wafer.
The Center X and Center Y fields will populate with this center point in stage coordinates.
Make sure to Save Alignment. We will save ours as “5x Bare Wafer Demo Alignment”.

Creating Predictive Focus Point Pattern
After creating an alignment, users must create a focus point pattern as a prerequisite to scanning. Creating an image setting group and autofocus setting are prerequisites to creating an alignment file, which is a prerequisite to creating a focus point pattern.
The focus point pattern indicates where the system will measure the sample’s z-heights. These z-height measurements are used as inputs to a surface prediction algorithm, which is used to predict what the focus should be set to across the sample during scanning.
The focus point pattern dialog can be found at nScan - Full Stage View > Scan > Edit Predictive Focus Patterns…
To start, name and save the pattern. We will name ours “5x Bare Wafer - Manual Demo 9 Pt Square”. Next, load the alignment file created in the previous step.
After loading the alignment file, we will set the origin as a focus point. To do this, we will navigate to the origin with the Move to Origin button. This origin is the same as the center point found in Bare Wafer Alignment.
Once at the origin, click the Add Point button at the bottom of the dialog, which will add the origin point to the list of focus points.
For this 150 mm bare silicon wafer, we will generate a square with 50 mm sides and 3 points per side. Under the Point Generator section:
1. Set Side Length, which is in µm, to 50000
Set Number of Points per to 3.
Click Add.
Click Generate.
Save the pattern.
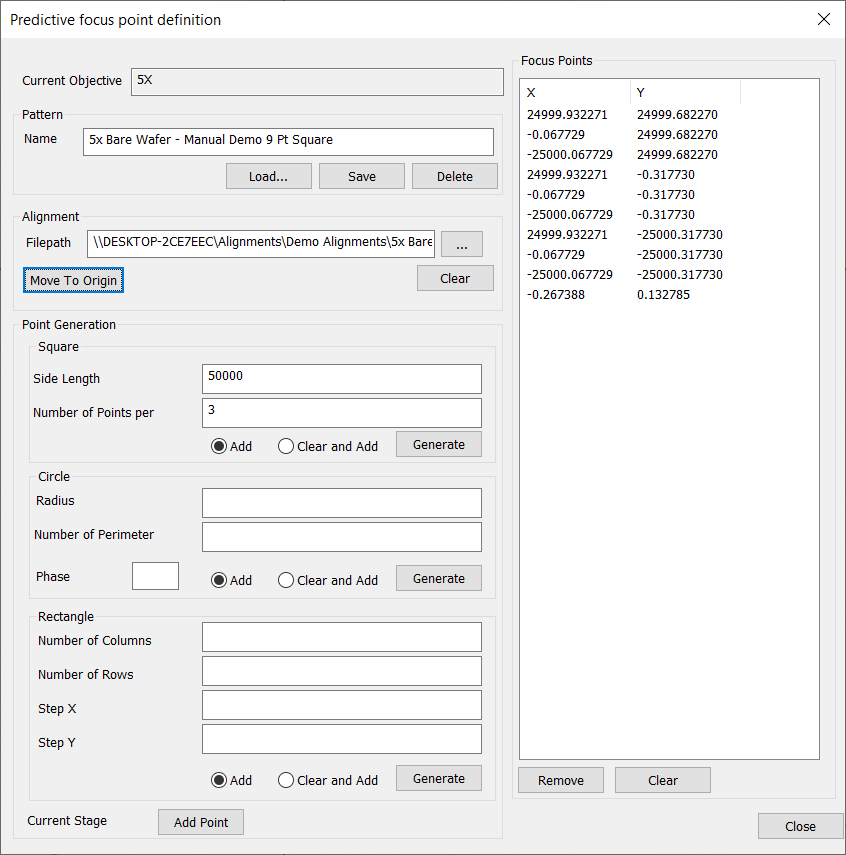
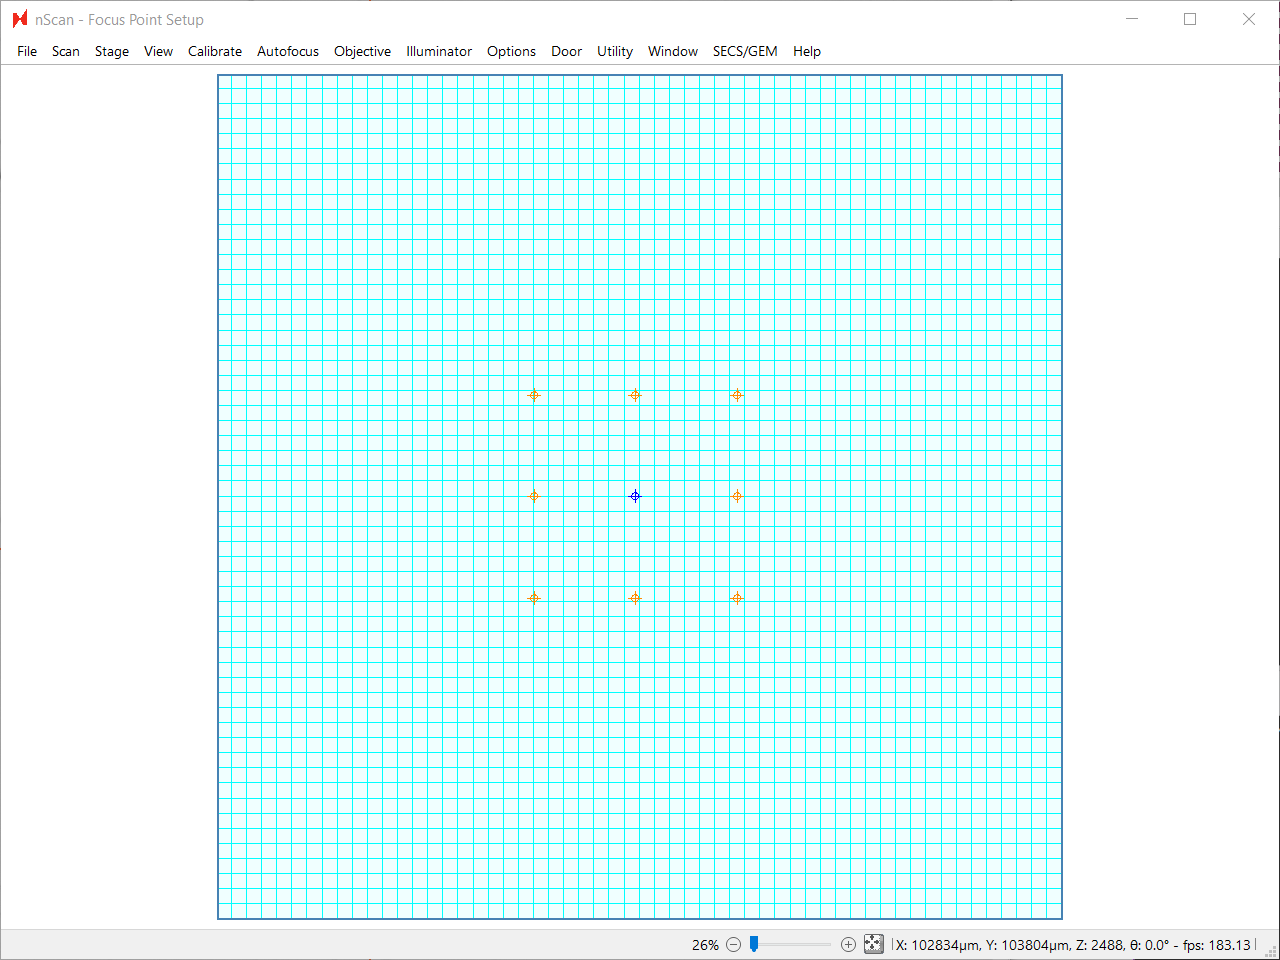
The generated focus points will appear both in the Focus Points column in the Predictive focus point definition dialog and in the nScan - Stage View dialog.
Scan Setup
After compiling all of the prerequisites needed to setup a scan, it’s time to finally setup and run the scan.
We’ll fill out the following fields with these prerequistes:
Under Scan Settings, we’ll name the sample “5X Bare Wafer - Manual Demo” for demonstration purposes.
Under Focus, we will point to the Autofocus Settings and Predictive Focus Pattern created for this sample.
Under Pattern , we will make sure that we run a Wafer type scan, and point to the Bare Wafer Alignment in the Alignments field.
Under Current Imaging Settings, we will set the Image Setting.

Configuring Post Scan Analysis
Next, we will configure the post scan analysis to run Basic Selection, which will perform defect detection on the scanned wafer images. For more on each of the Basic Selection variants, see Basic Selection Analyzer.
We will choose to run Basic Selection (Intensity, Exclusive) with default parameters for our first scan, and will likely refine the analysis parameters once we see the result of the scan.
Save the Job, then click OK to run the scan.
Viewing Analysis Results
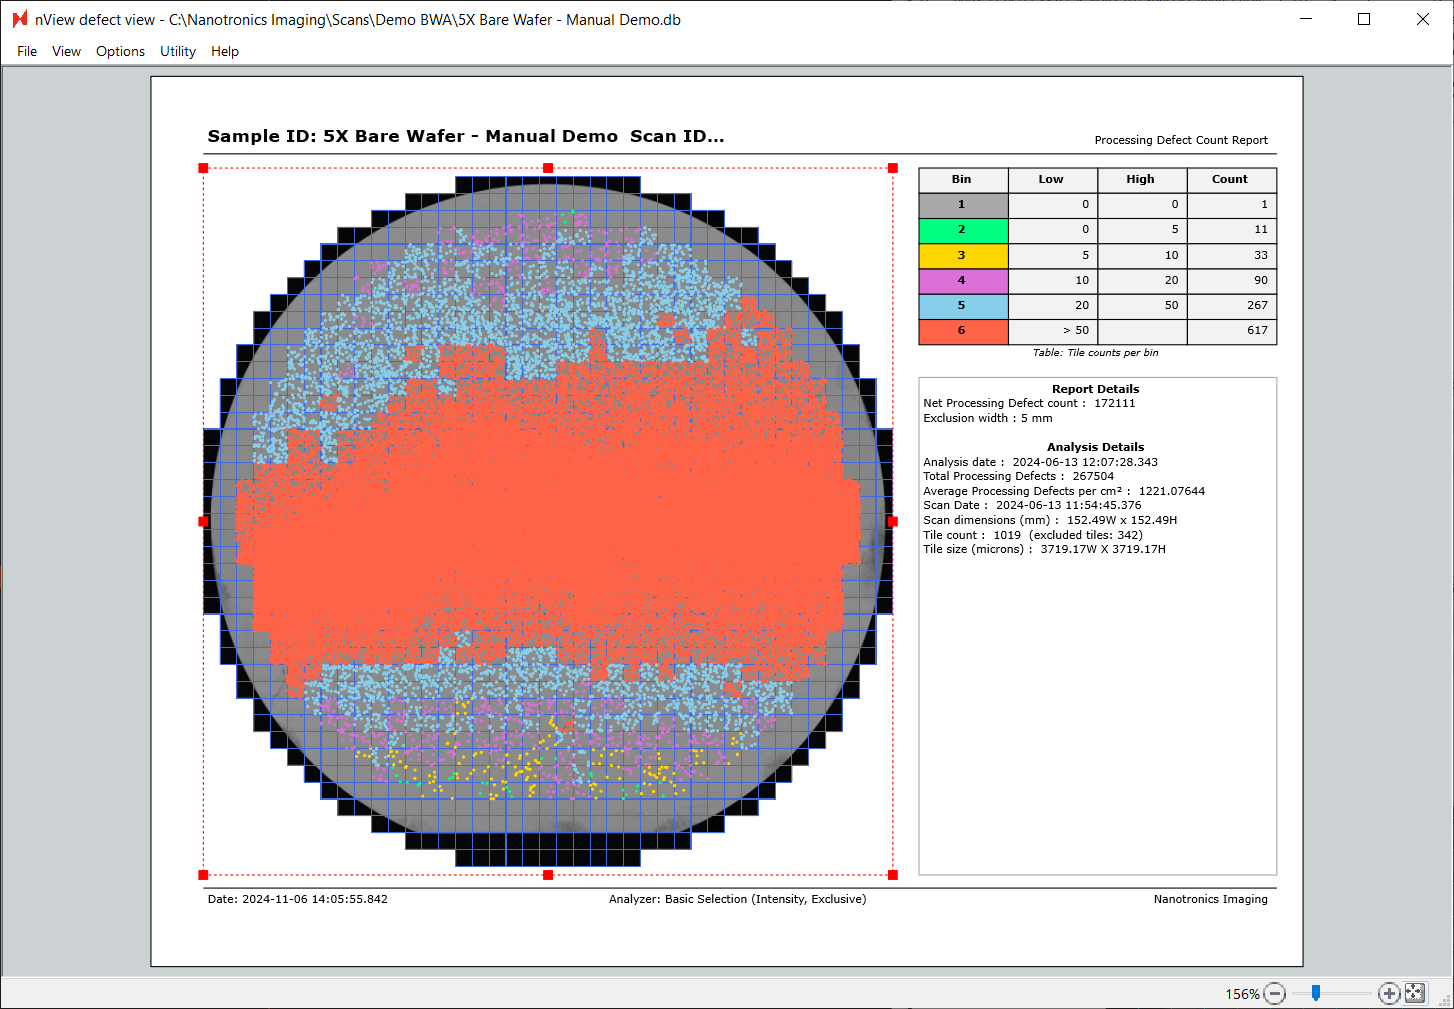
After running the scan, you can view the scan and analysis results by selecting the appropriate scan at nSpec Main View > Analysis > View Analysis Results…
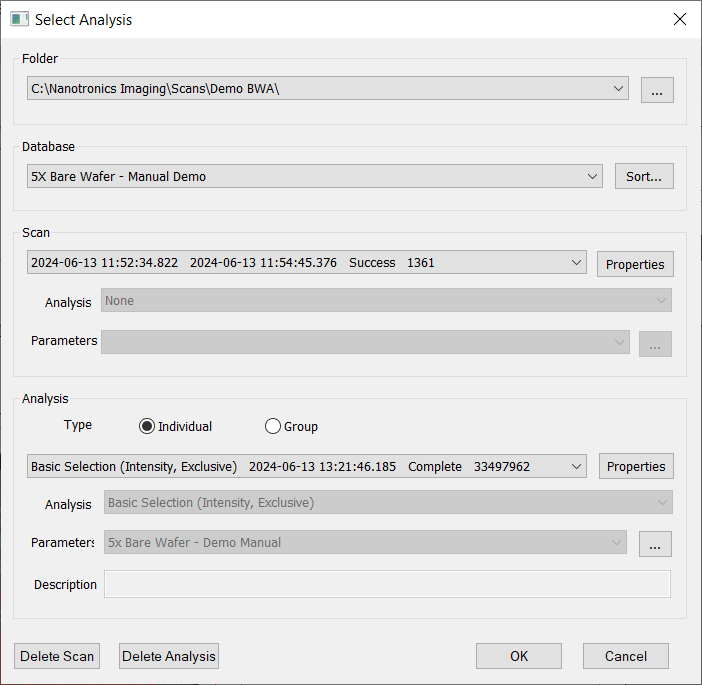
Clicking OK will open the analysis results. Below is the Defect Count Report, which can be toggled at nView defect view > View.
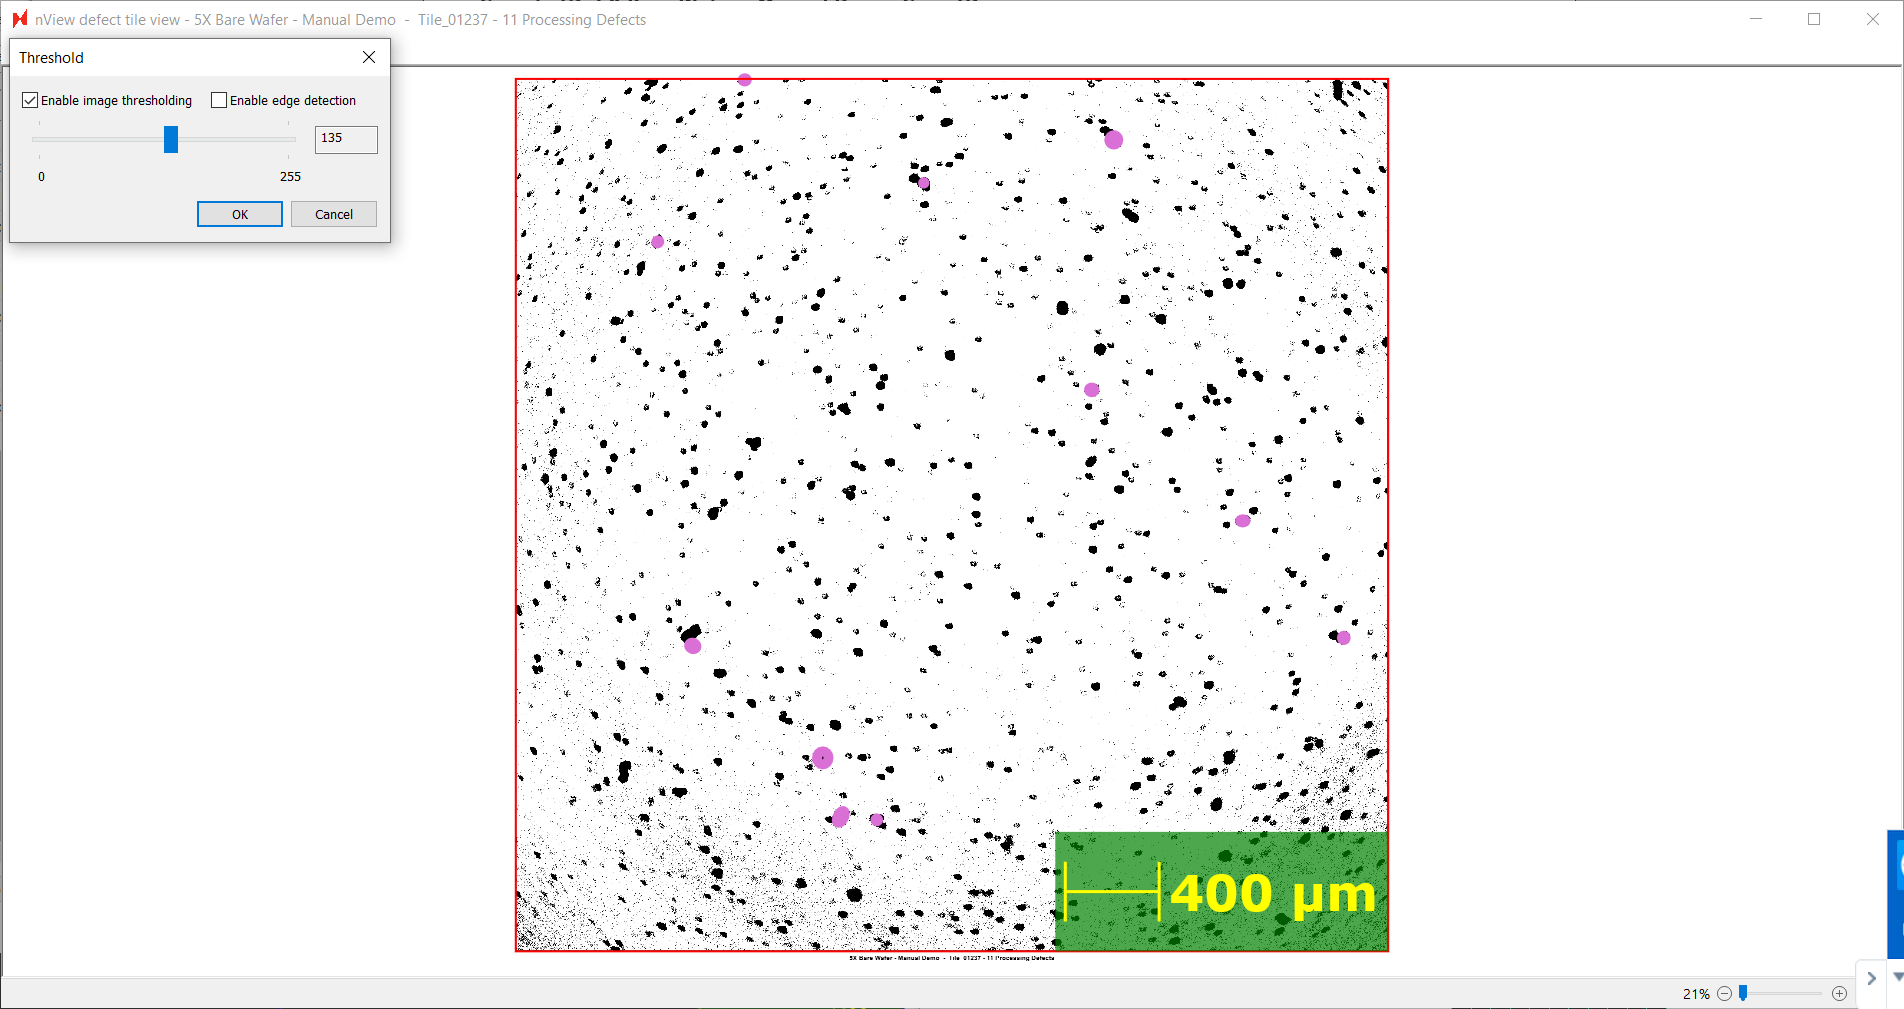
Double clicking any of the tiles on the report grid will open up an individual tile’s scan. In the tile view, toggle image thresholding with nView defect tile view > Display > Adjust threshold… Check Enable thresholding
Using the thresholding tool, we find that when thresholding is set to 135, there is a lot of noise in the background of the image. Additionally, most defects have not been detected. Detected defects are circled in purple.
Lowering the threshold to 132, we see that most of the background noise is gone. Thus, we should set the Darkest Background Intensity parameter for Basic Selection (Intensity, Exclusive) to be 132, and the Brightest Background Intensity to be 255. This means that any pixel with an intensity of 132 or higher will be considered part of the background, and any pixel intensity between 0-132 will be marked as a defect.
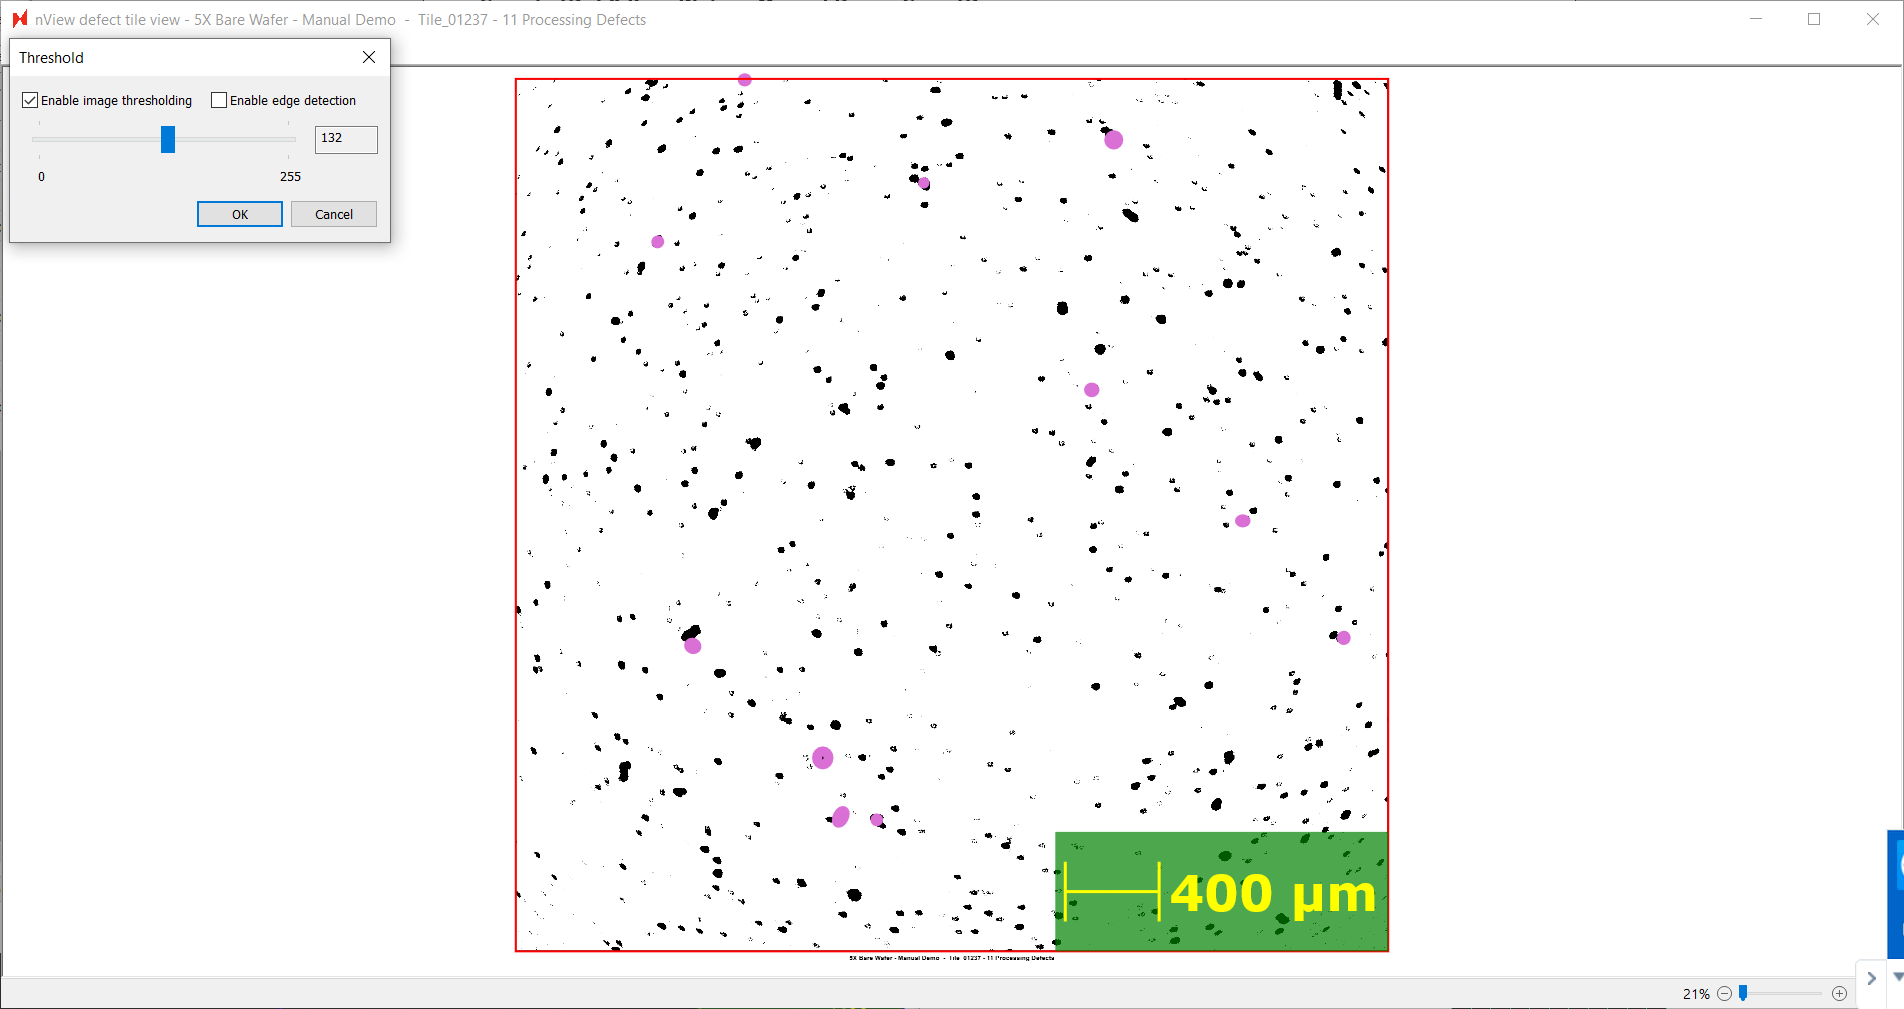
Re-running the scan with the following analysis parameters will result in accurate defect detection on this bare silicon wafer.
