
Flatness Report
Overview
The Flatness Report is an addition to nView that renders the surface of any nSpec scan. This can help you understand the surface topology of your samples. This feature can also help you troubleshoot autofocus settings by allowing you to visualize your sample surface when a Surface Prediction algorithm is not characterizing surface topology optimally. This is especially true if you use this in tandem with the new feature to save autofocus images during the scan.
The Flatness Report is available for all scans that included an autofocus step that generated a Predictive Focus map.
Note: previous versions of this documentation equated “flatness” to “bow”, which is inaccurate. Flatness and bow measurements are not equivalent terms. For more information about the differences between the terms, we recommend reading the definitions in http://www.mast-tech.com.tw/semi-definition.pdf.
Scanning
The Flatness Report will be available for any scan that used a surface prediction algorithm.
Reporting
Accessing the Report within nView
In addition to the Flatness Report now available to all scans, nSpec now also supports a special scanning mode that will allow you to perform a Flatness Analysis without vacuum so that a measurement can be performed without the stage vacuum pulling the sample flat during the measurement.
To utilize, simply check the new No Vac option checkbox on the Jobs dialog:

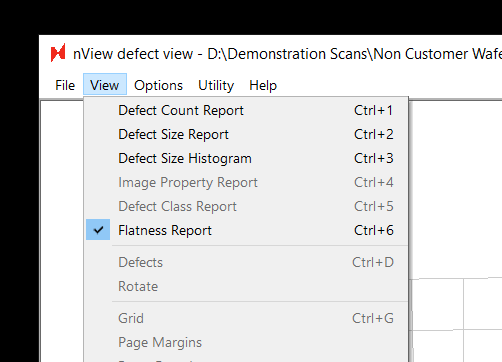
To find the Flatness Report for a scanned wafer, all you need to do is navigate to the new Flatness Report option (ctrl+6) when viewing results in nView:
On the left the report shows an interactive 3-dimensional rendering of the sample. On the right, the same data is rendered from a top-down perspective. The scale bar in the center displays the nSpec stage Z coordinates corresponding to a given color on the two maps.
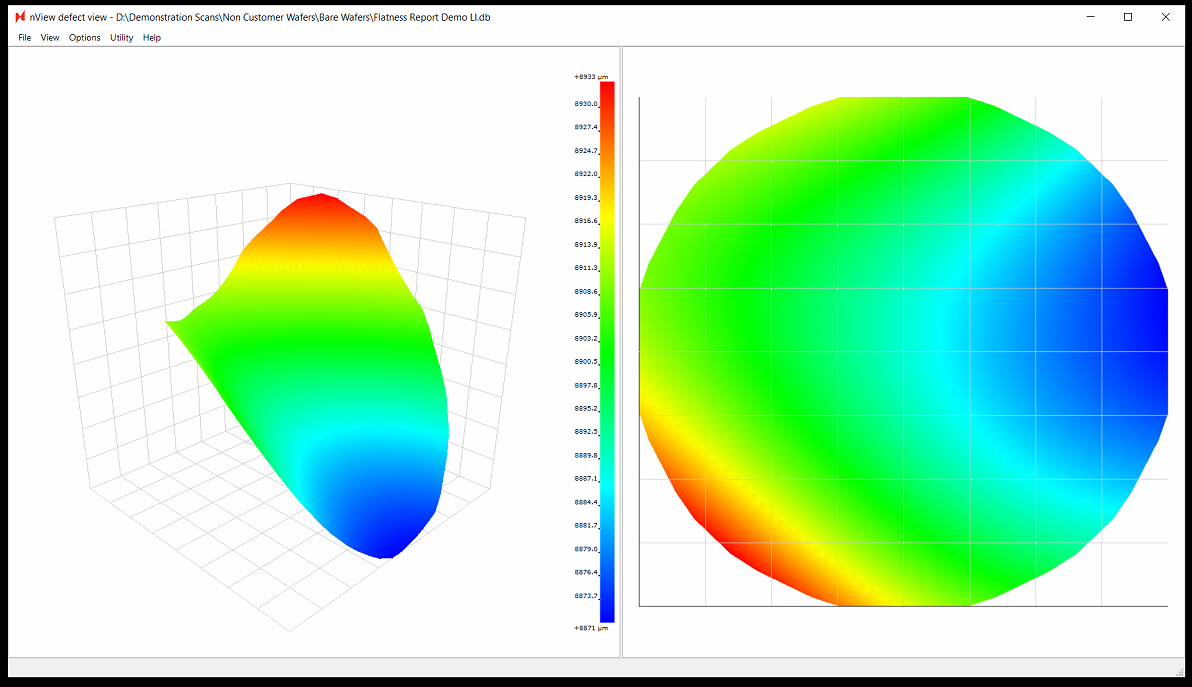
Note: when viewing results in nView, the Flatness Report values includes any potential tilt in the stage. However, the values in the exported Flatness Report PNG file are corrected for tilt.
Exporting a PNG Report
Since the Flatness Report doesn’t require an explicit analysis to be performed and is extended to all scans, triggering a Flatness Report is a bit different from other exports in nSpec. Elsewhere you have analysis parameters to control JSON, CSV, and image exports.
To export a full flatness report, you need to use a new Job Property:
Name | Value Type | Description |
|---|---|---|
ExportFlatnessReport | Bool (TRUE, FALSE) | Enable flatness report export after scan succeeds |
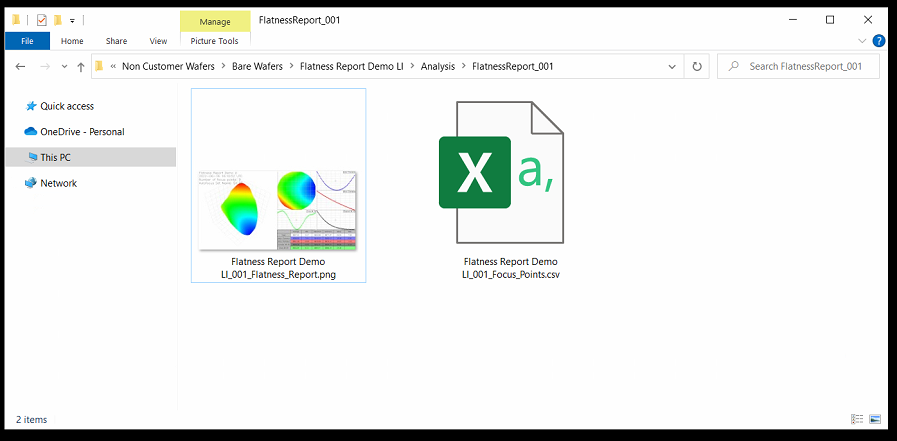
After the scan is completed, a folder will be added in the location dictated by the ReportExport program option.
This folder will be named FlatnessReport_<Scan_ID> (ex. FlatnessReport_001).
Within this folder will be two files:
<Sample ID>_<Scan_ID>_Flatness_Report.png
<Sample_ID>_<Scan_ID>_Focus_Points.csv
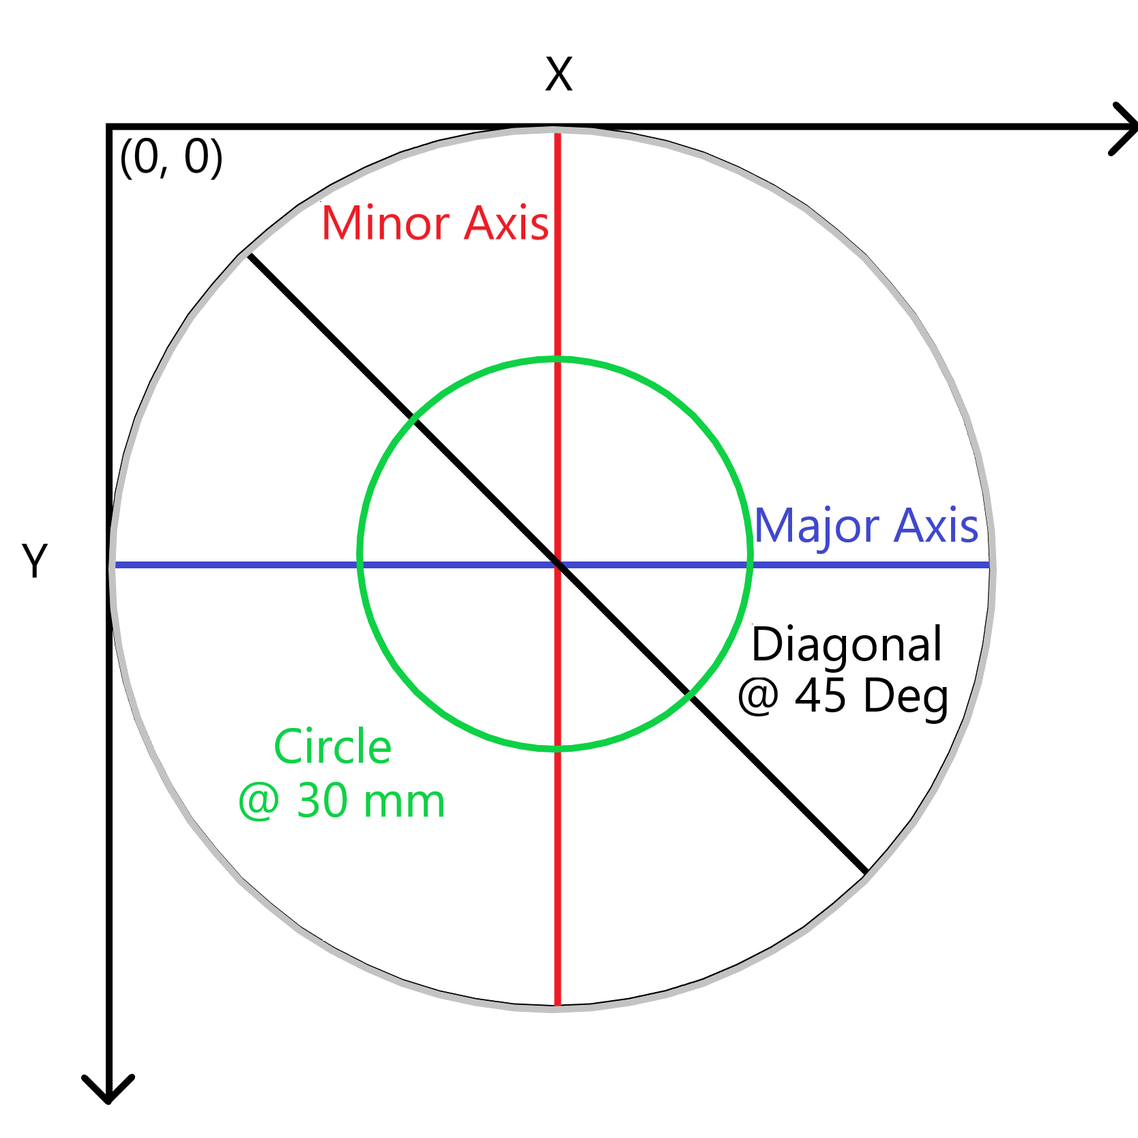
Since our stages have their Y axis flipped (0,0 is the TOP left of the stage when facing the nSpec machine) the values will appear flipped:
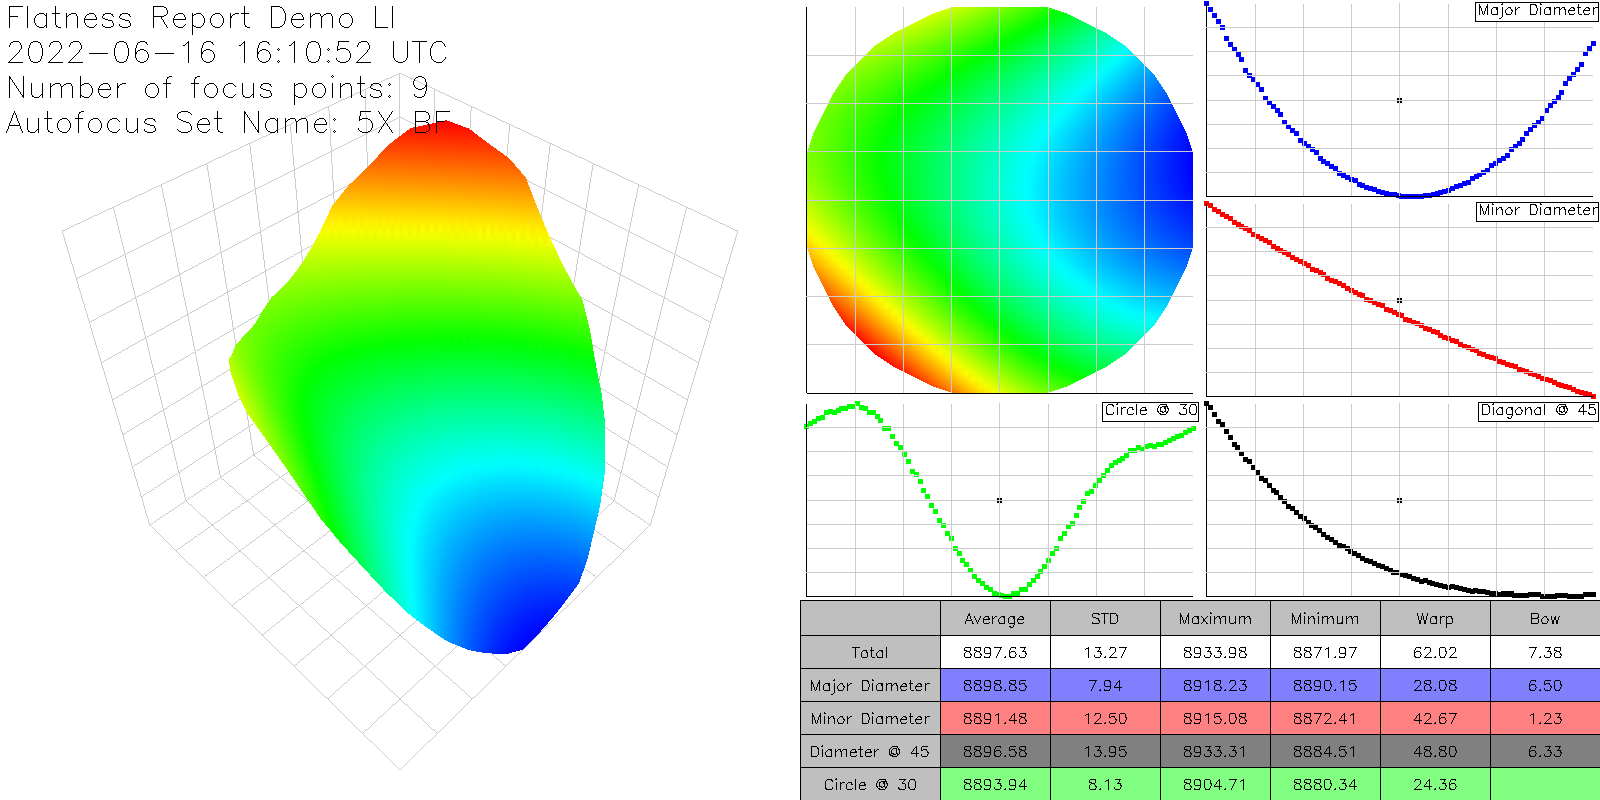
The image export has the following information, corrected for any potential tilt in the stage:
3D orthogonal view (scatter plot)
Top-down view
Major axis slice
Minor axis slice
45 degree slice
30 mm ring slice (hardcoded 30 mm)
Table of calculations: Average value, Standard deviation, Min, Max, Bow, Warp
An example Flatness Report PNG:
As well as a raw and simple CSV export of the focus points collected during the scan:
X (µm) | Y (µm) | Z (µm) |
|---|---|---|
103349.9 | 133045 | 8900.789 |
61099.9 | 133045 | 8913.055 |
61099.9 | 90795.02 | 8907 |
61099.9 | 48545.02 | 8933.602 |
103349.9 | 48545.02 | 8905.148 |
103349.9 | 90795.02 | 8890.289 |
145599.9 | 90795.02 | 8876.977 |
145599.9 | 48545.02 | 8891.602 |
145599.9 | 133045 | 8884.781 |